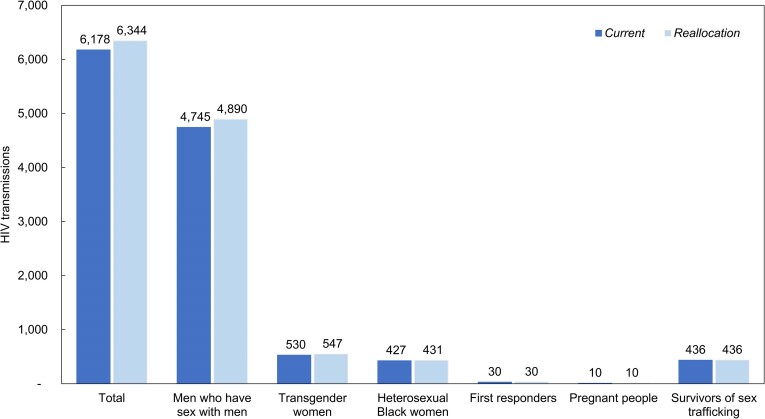
Figure 1.
Cumulative HIV transmissions among the modeled populations at 10 y in the Current and Reallocation strategies. This figure depicts the number of HIV transmissions over 10 y resulting from the Current (dark shade) and Reallocation (light shade) strategies for each modeled subpopulation. Primary HIV transmissions among the simulated risk groups are included. Secondary transmissions arising from these primary transmissions were not considered. Abbreviation: HIV, Human immunodeficiency virus.

