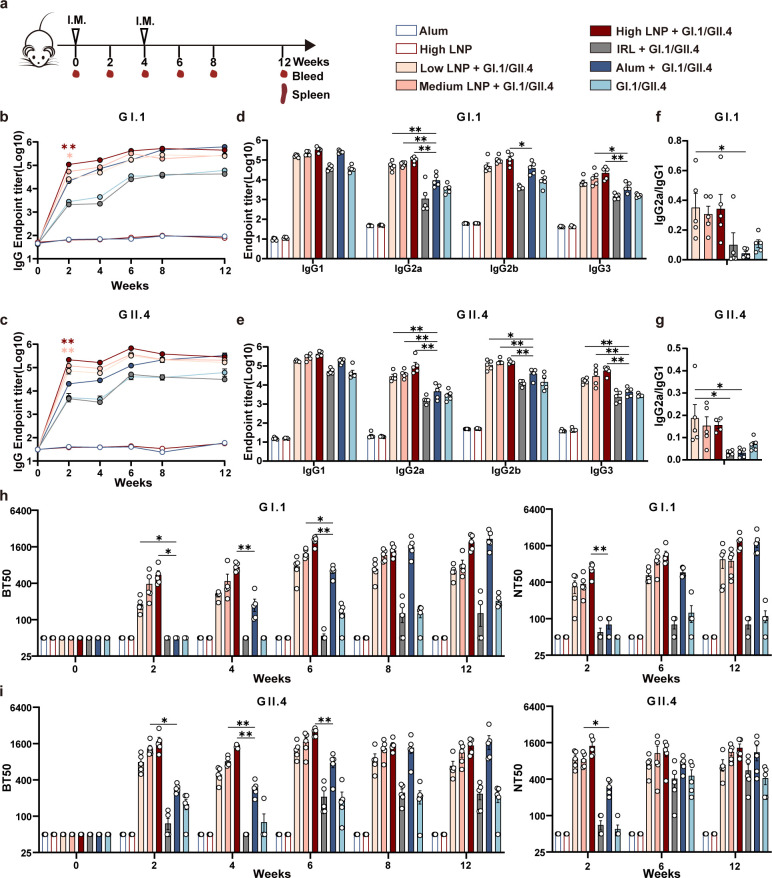
Fig 1.
LNP-adjuvanted vaccines augment antibody production. (a) Immunization schedule. BALB/c mice (n = 5/group) received two shots i.m. at weeks 0 and 4; GI.1 and GII.4 VLPs were mixed with low, medium, and high doses of LNP, Alum, or IRL. Alum, high LNP, and GI.1/GII.4 VLPs were set as the control. Serum was collected every 2 weeks between week 0 and 8 and at week 12 post-priming. Binding IgG against (b) GI.1, (c) GII.4 VLPs were detected using enzyme-linked immunosorbent assay (ELISA). IgG subclasses against (d) GI.1, (e) GII.4 VLPs were detected using ELISA collected at week 6. IgG2a/IgG1 ratio was calculated for GI.1 (f) and GII.4 (g). Blockade antibody titers were determined using a VLP-mucin binding blockade assay, and neutralizing antibodies were determined using NoV VLP-HiBiT-based live-cell entry assay system. Blockade antibody results against (h) GI.1 and (i) GII.4 VLPs were shown on the left, and neutralizing antibody results were shown on the right. Data are shown as mean ± SEM. (b and c) shows statistical differences between the low, medium, and high LNP + GI.1/GII.4 group and Alum + GI.1/GII.4 group at week 2. (d–i) shows statistical differences between the low, medium, and high LNP + GI.1/GII.4 groups and the Alum + GI.1/GII.4 group. [Two-way analysis of variance (ANOVA) with Tukey’s multiple comparison test for b–e, h–i; one-way ANOVA with Tukey’s multiple comparisons test for f and g. *P < 0.05;**P < 0.01].

