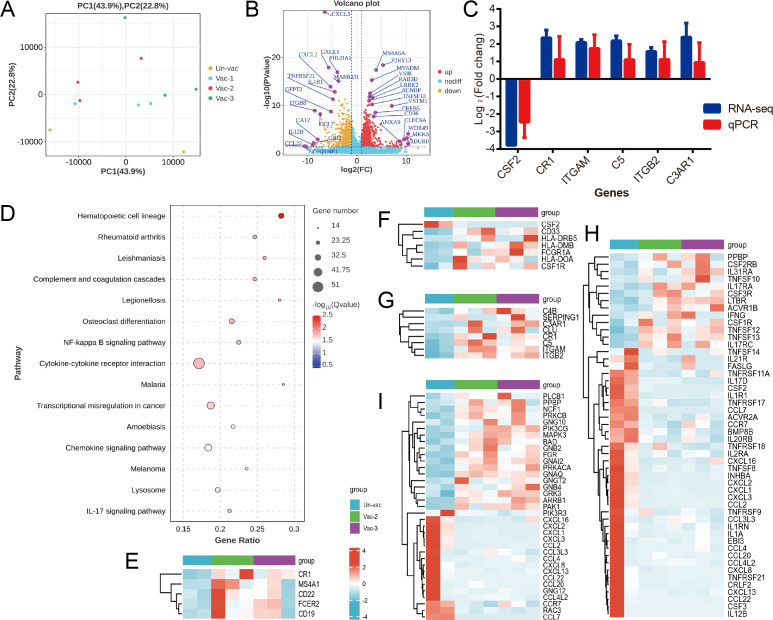
Fig 6.
Gene expression signature of peripheral blood mononuclear cells between the two- or three-dose vaccinated group and the unvaccinated infection group. (A) Principal component analysis of the gene expression data computed for all of the genes from the different vaccination groups. (B) Volcano plot showing differentially expressed genes between the Vac-2/3 and Un-vac groups. (C) Validation of differentially expressed genes by quantitative real-time polymerase chain reaction. (D) Enriched Kyoto Encyclopedia of Genes and Genomes pathways among the differentially expressed genes between the Vac-2/3 and Un-vac groups. (E) Heatmap of significantly upregulated B cell surface molecule genes between the Vac-2/3 and Un-vac groups. (F) Heatmap of differentially expressed monocyte surface molecule genes between the Vac-2/3 and Un-vac groups. (G) Heatmap of differentially expressed complement pathway genes between the Vac-2/3 and Un-vac groups. (H) Heatmap of differentially expressed cytokine and chemokine genes between the Vac-2/3 and Un-vac groups. (I) Heatmap of differentially expressed chemokine genes between the Vac-2/3 and Un-vac groups.

