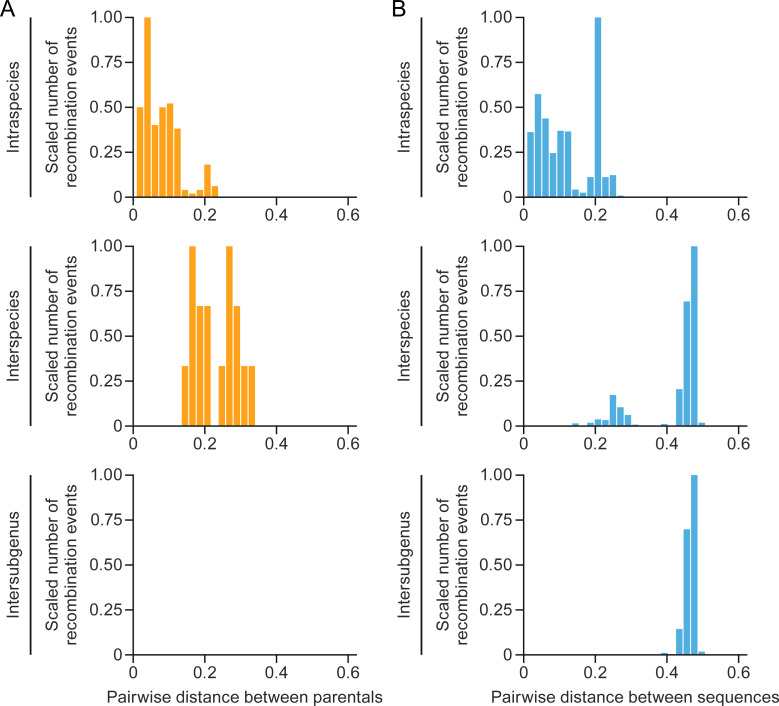
Fig 1.
Recombination among betacoronaviruses is biased toward lower pairwise genetic distances. Splitting at different taxonomic ranks (intraspecies, interspecies, and intersubgenus): (A) the distribution of recombination events involving parental viruses; (B) the distribution of all distances among sequences in the whole data set. The number of recombination events is scaled based on the highest value (which get the value of 1).

