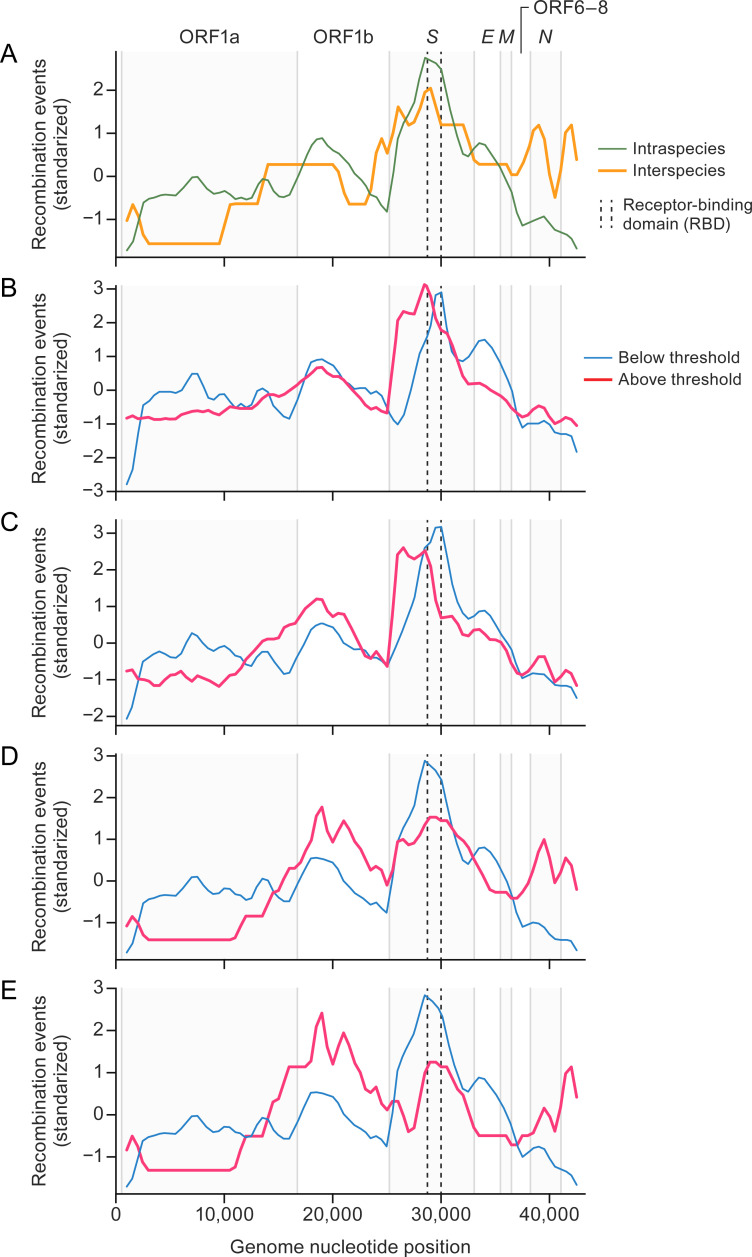
Fig 3.
Interspecies and intraspecies recombination events tend to occur at different genome locations in betacoronaviruses. (A) Sliding window analysis (length 1,000 nt, steps = 500 nt) of the mean number of recombination events along the genome. Because the number of events is close to zero, expressed in log1p scale: intraspecies (thin green line) vs interspecies (thick orange line). (B–E) Sliding window analyses, splitting the groups by pairwise genetic distances (0.08, 0.10, 0.15, and 0.20) between parental viruses: events below the threshold (thin blue line) vs events above the threshold (thick red line). The distribution of recombination events is shown transformed by standardization (mean = 0, SD = 1). Vertical lines represent open reading frame (ORF) boundaries; dashed lines show the receptor binding domain within the spike [S] protein ORF.

