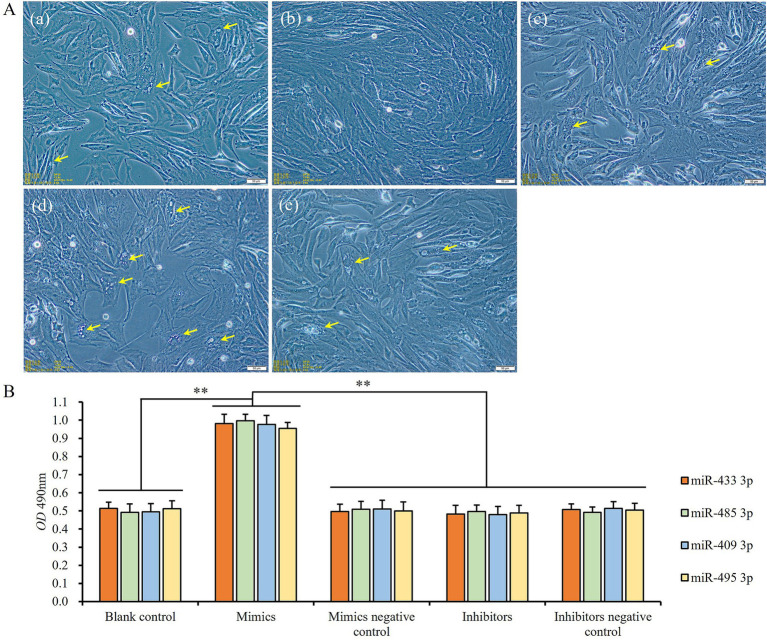
Figure 8.
The influence of miRNA expression levels on proliferation and differentiation of preadipocytes: (A) cell states of blank control (a), miR-433-3p mimics (b), miR-433-3p negative control (c), miR-433-3p inhibitors (d), and miR-433-3p inhibitors negative control (e); the yellow arrows show the tiny lipid droplets; the scale line indicates 50 μm; (B) the difference of cell number among different groups; **indicates significant difference (p < 0.01).

