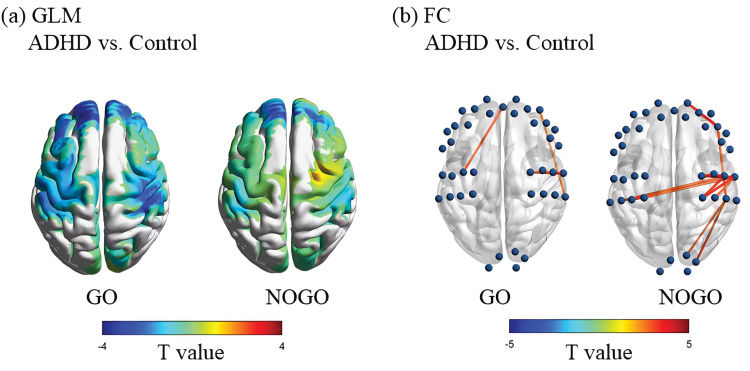
Figure 2.
Differences in brain activation and functional connectivity of brain areas during GONOGO tasks between ADHD and control groups.
Notes: (a) The colors of the brain regions in the figure represent the t-values from the general linear model (GLM) analysis comparing the ADHD group and the control group during the GO or NOGO conditions. (b) The blue spheres represent different channels, and the lines connecting the spheres indicate significant differences in functional connectivity (FC) between the two groups in these channels. The thickness of the lines reflects the strength of the t-values. Only channels with a p-value < 0.01 are shown.

