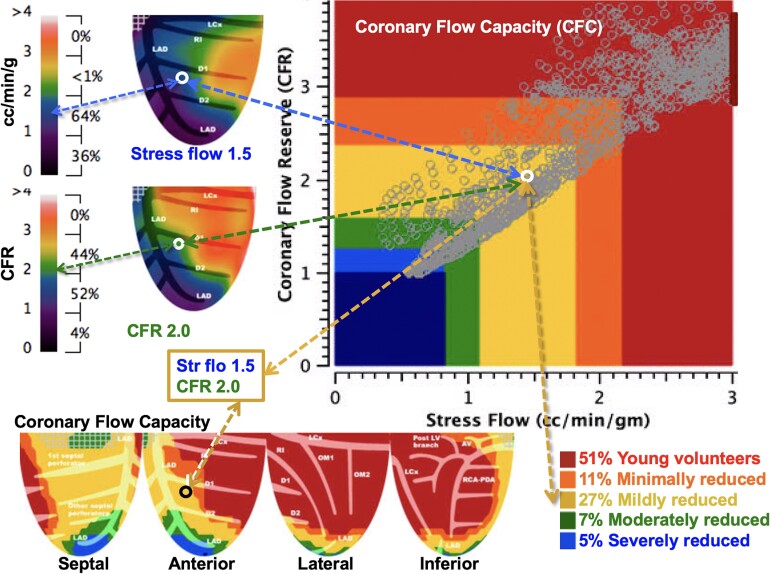
Figure 2.
CFC map objectively quantifies rest–stress perfusion and CFR per regional pixel and their combination in pre-specified ranges, colour coded by well-defined clinical groups and back projected into their LV position. Artery-specific size severity of CFC as a percentage of LV is the comprehensive, integrated perfusion metric associated with risk of adverse events with and without revascularization (see text).

