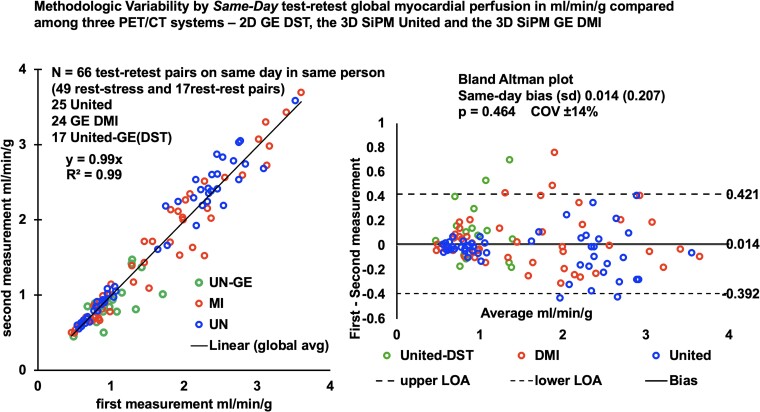
Figure 3.
Methodological variability of serial paired ‘same-day’ global rest–stress myocardial perfusion in millilitres per minute per gram in the same subject between 2D GE DST and 3D United µMI550 and the 3D United µMI550 and 3D GE DMI PET-CT scanners compared with themselves with a combined COV of ±14%, in contrast to methodological (same-day) plus biologic (different-day) variability of ±20% from Figure 5 (Graphical Abstract).

