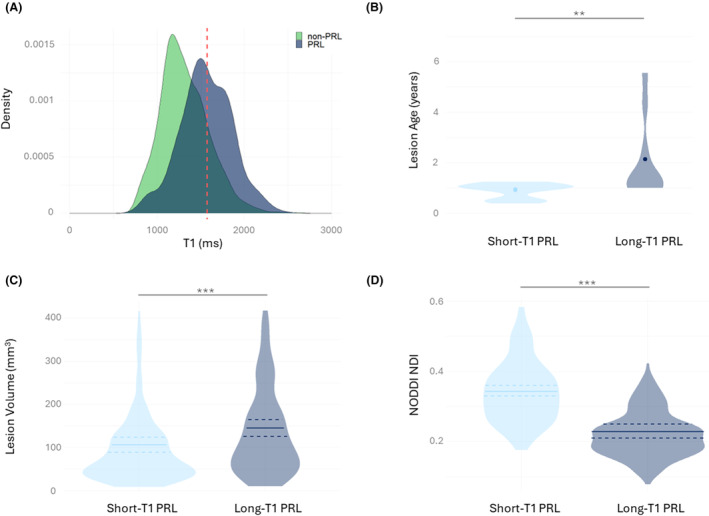
Figure 3.

PRL heterogeneity and its importance in lesion stratification. (A) Density plot of T1 values in non‐PRL and PRL. Red line indicates calculated long‐T1 cutoff at 1572 ms. N = 1860. (B) Lesion age comparison between short‐T1 and long‐T1 PRL. N = 39. (C) Lesion volume comparison between short‐T1 and long‐T1 PRL. N = 427. (D) NODDIs NDI comparison between short‐T1 and long‐T1 PRL. N = 427. ns = not significant, *P/P FDR < 0.05, **P/P FDR < 0.01, ***P/P FDR < 0.001, ****P/P FDR < 0.0001. NDI, Neurite Density Index; NODD, neurite orientation dispersion and density imaging.
