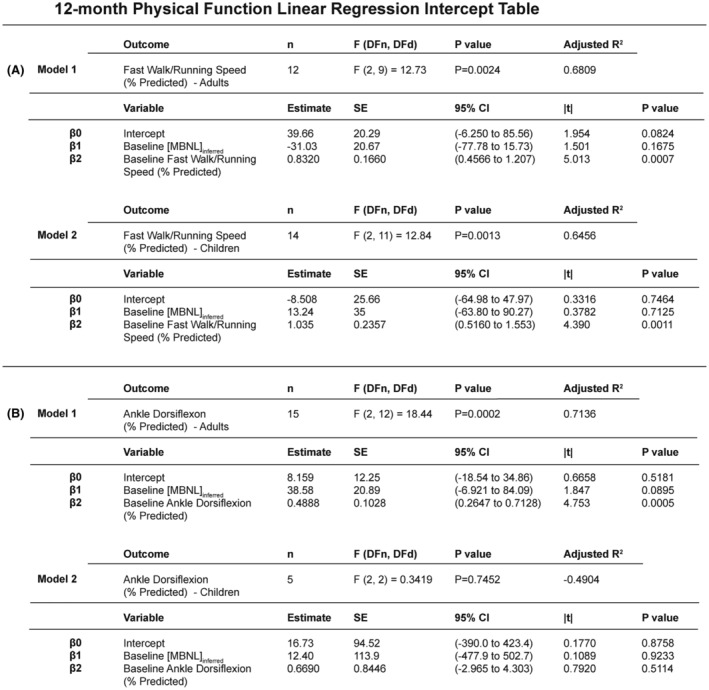
Figure 6.

Multiple linear regression predictive models of 12‐month ankle dorsiflexion strength and 10‐meter walk/running speed in DM1 participants. Intercept table of multiple linear regression models for (A) 12‐month walk/running speed (% predicted) and (B) 12‐month ankle dorsiflexion strength (% predicted) using baseline [MBNL]inferred values and baseline physical function values. Multiple statistical elements are reported (|t|, t‐test statistic; 95% CI, 95% confidence interval; DFd, degrees of freedom denominator; DFn, degrees of freedom numerator; F, F‐distribution; SE, standard error). Extended intercept tables for the 12‐month walk/running speed models and 12‐month ankle dorsiflexion strength are in Tables S5 and S6, respectively.
