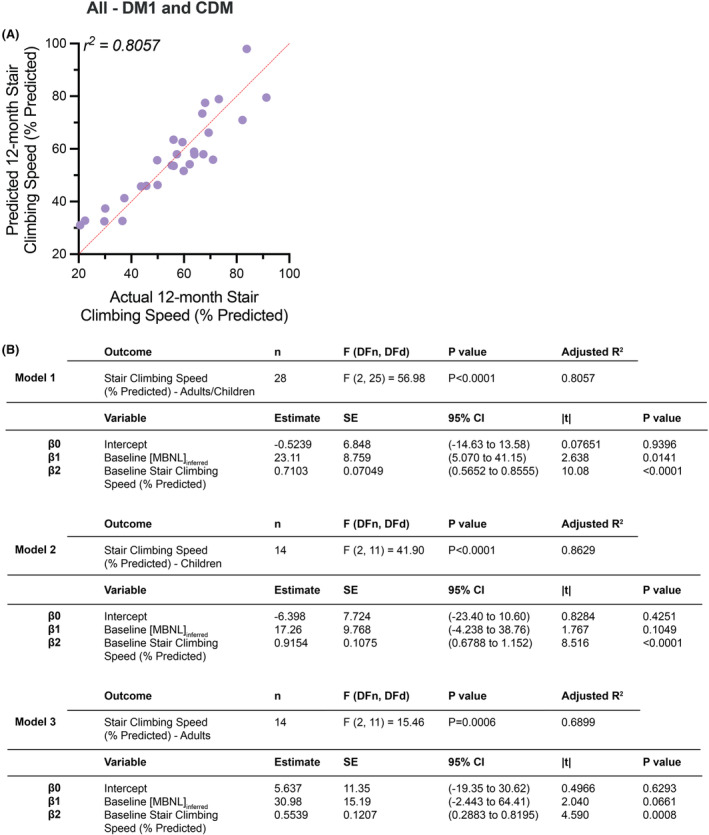
Figure 7.

Multiple linear regression predictive modeling of 12‐month stair climbing speed in DM1 participants. (A) Multiple linear regression plot showing observed 12‐month stair climbing speed (% predicted) versus predicted 12‐month stair climbing speed (% predicted) for all DM1 individuals (adults and children). (B) Intercept table of multiple linear regression models for complete DM1 cohort (Model 1), CDM cohort alone (Model 2), and adult cohort alone (Model 3). Multiple statistical elements are reported (|t|, t‐test statistic; 95% CI, 95% confidence interval; DFd, degrees of freedom denominator; DFn, degrees of freedom numerator; F, F‐distribution; SE, standard error). Extended intercept tables for all three models are provided in Table S7.
