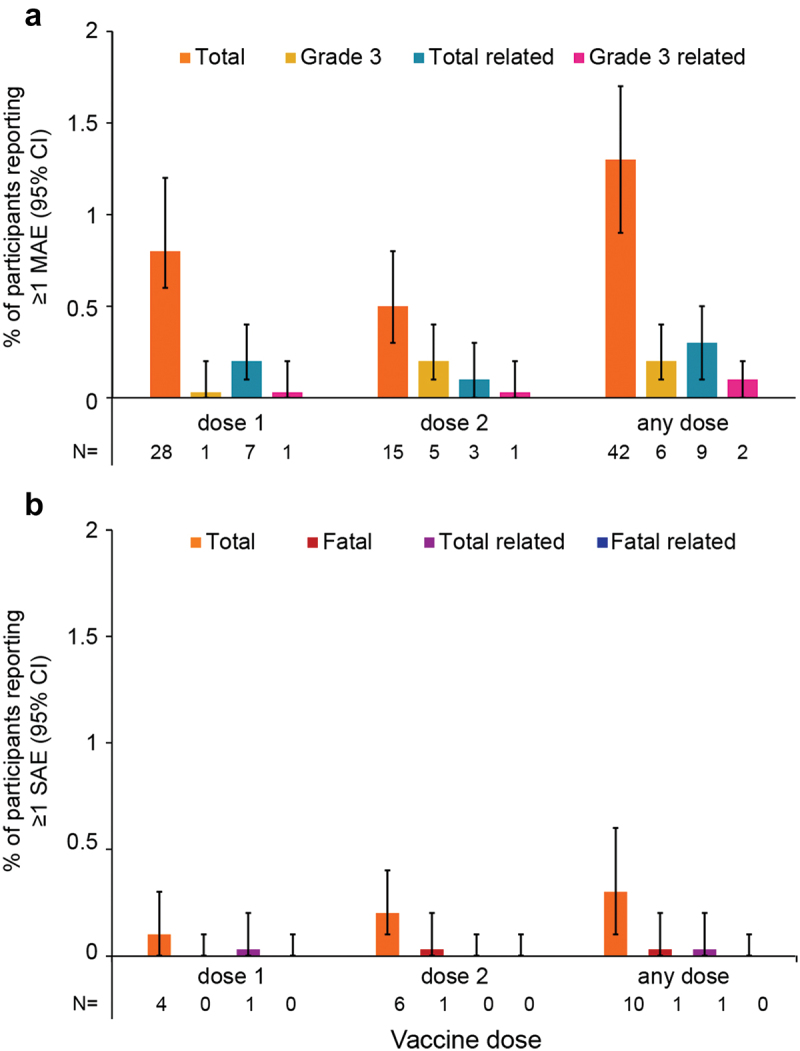
Figure 3.

Number* and proportion of participants reporting at least one MAE (a) or SAE (b) within 30 days after vaccination, stratified by dose and overall.
* The numbers below each graph (N) correspond to numbers of participants reporting a given adverse event; CI, confidence interval; MAE, medically attended adverse event; SAE, serious adverse event.
The term “Total” refers to all reported MAEs or SAEs, “Grade 3” refers to MAEs with a grade 3 intensity, “related” refers to MAEs or SAEs assessed by the investigator to be related to vaccination. Error bars represent 95% CIs.
