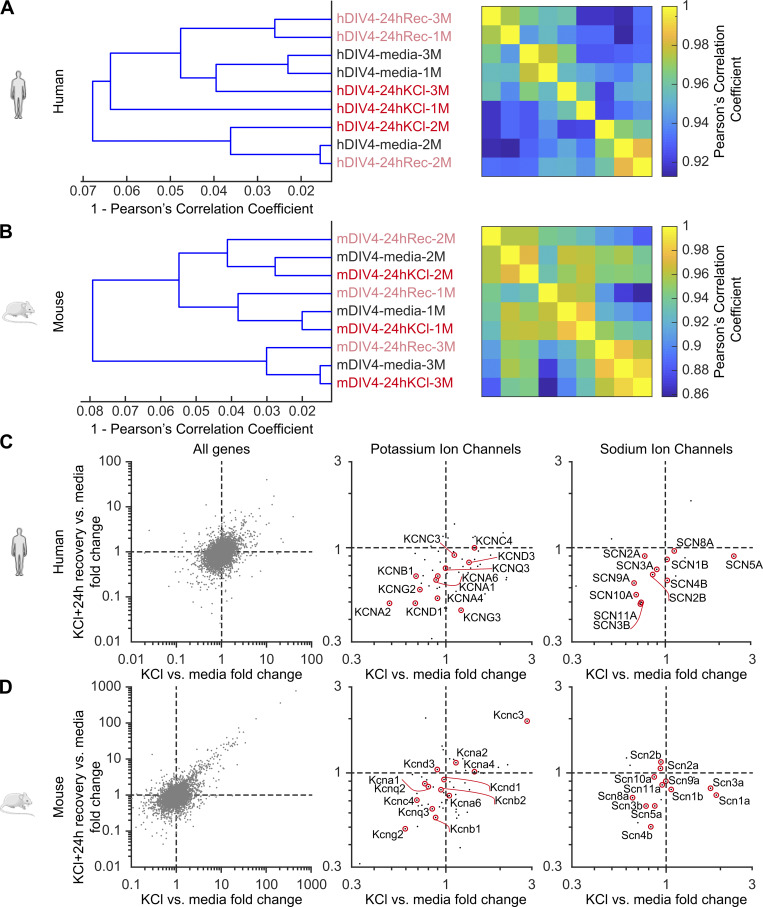
Figure S4.
Assessment of global gene expression in mouse and human DRG neurons following sustained depolarization. (A and B) Hierarchical clustering of RNA-seq samples from human and mouse DRG sensory neurons. N = 3 cultures each, denoted by #1–3. Neurons were collected after ∼4 days in vitro and the following treatment groups were studied: Media (control), 24 h KCl (24 h cultured in KCl media), and 24 h Rec (additional 24 h recovery in fresh media after cultured in KCl for 24 h). (C and D) Differential gene expression analysis between condition with KCl versus media fold change (X-axis) and 24 h Rec versus media (Y-axis). Middle and right panels: Isolated potassium and sodium ion channels for better representation.

