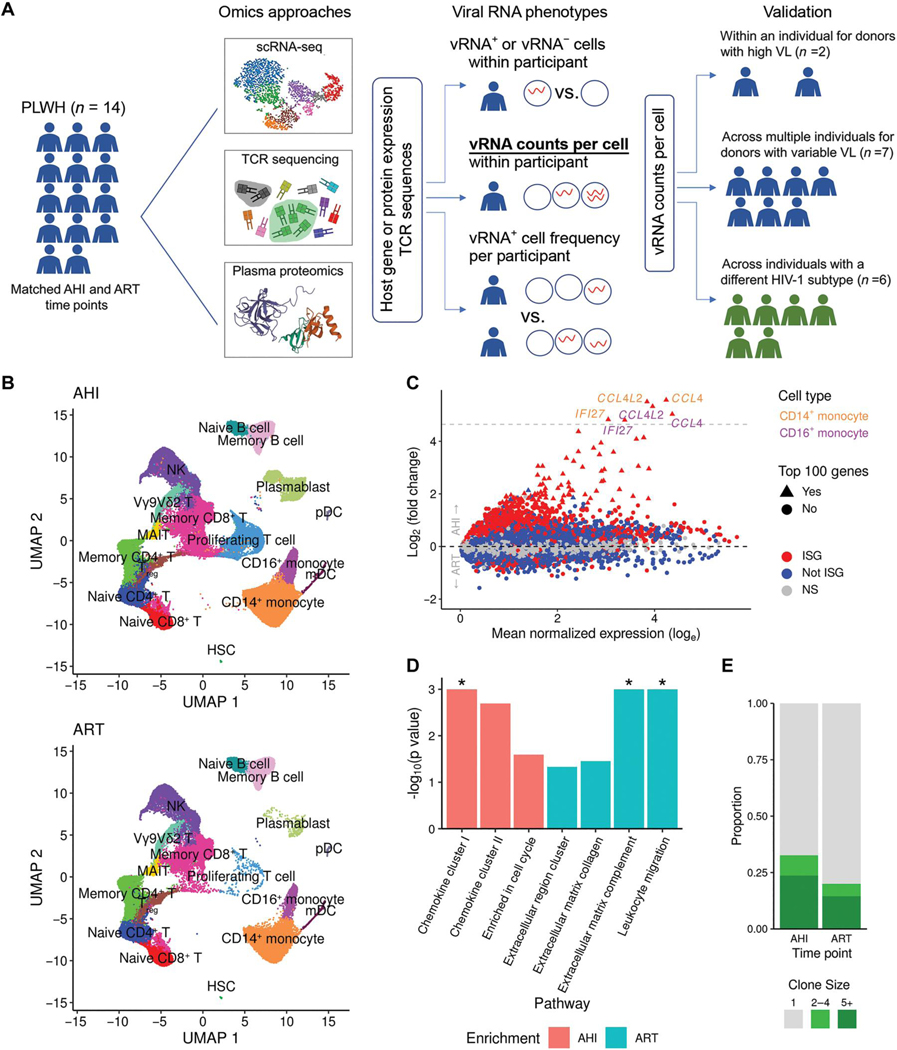
Fig. 1. Longitudinal single-cell multiomics confirm that IFN responses dominate differences between the AHI and ART time points in an acutely treated HIV cohort.
(A) scRNA-seq, TCR sequencing, and plasma proteomics data were generated from samples collected from 14 people living with HIV (PLWH) who initiated treatment during AHI. Data were generated for samples from all 14 participants at two time points, including AHI and ART. Viral RNA phenotypes from single cells within participants and across participants that were used to assess correlations with host gene expression are indicated. Analytical approaches are also shown, and the method used to validate findings in individuals with different VLs and subtypes is highlighted in bold and underlined font. (B) Unsupervised clustering of single-cell transcriptomic phenotypes from the 14 PLWH who were treated during acute infection at two time points (AHI and ART). HSC, hematopoietic stem cell; mDC, myeloid dendritic cells; NK, natural killer; pDC, plasmacytoid DC. (C) DEGs between the two time points from the scRNA-seq dataset showing significant ISGs as red symbols. Gray dashed line indicates genes up-regulated more than 25-fold. (D) Differentially enriched protein pathways between the two time points from the plasma proteomics datasets. Significant results [false discovery rate (FDR) < 0.05] are shown with an asterisk. (E) Differences in TCR expansion between the two time points. Clone size indicates the number of cells in which the same TCR was detected.

