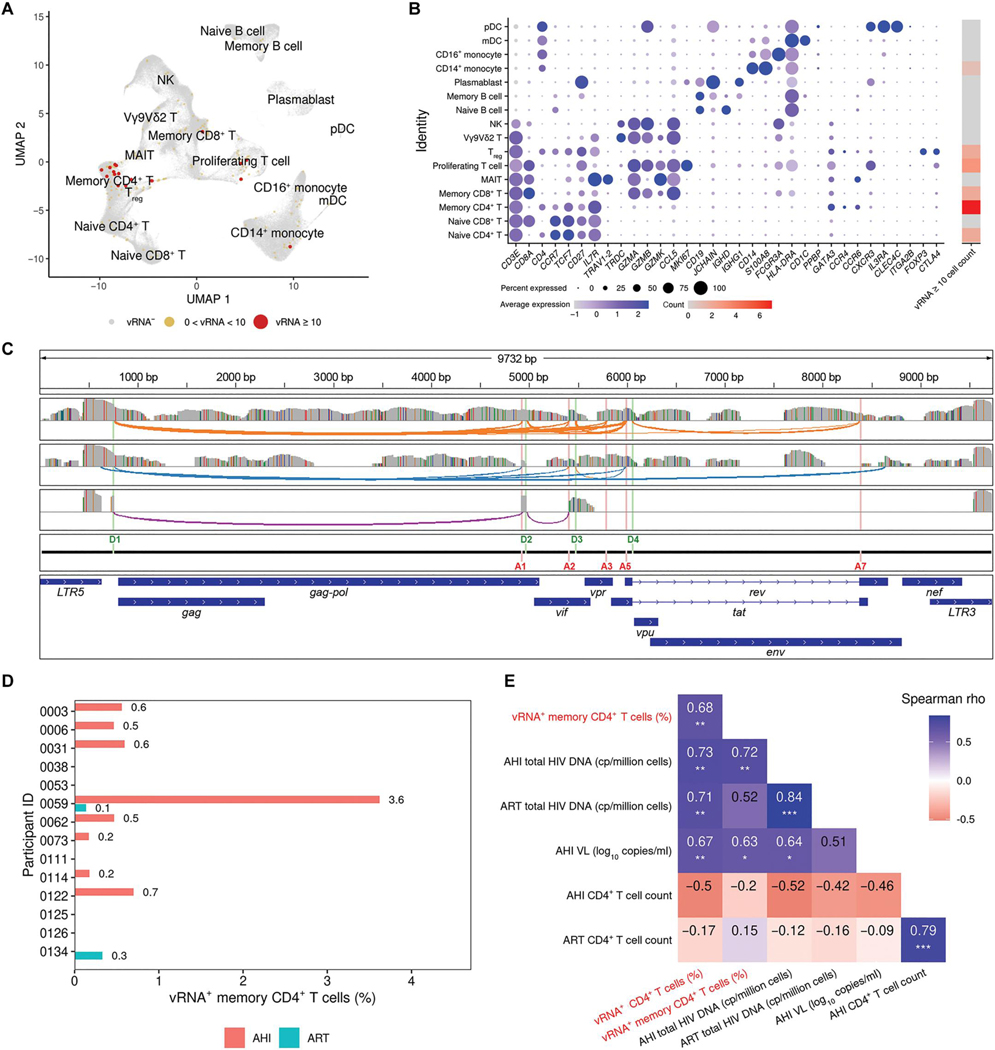
Fig. 2. HIV-1 vRNA transcripts identified during AHI span full viral transcriptomes and correlate with clinical parameters.
(A) High dimensionality reduction plot of single cells from PBMCs showing high viral reads mainly in the memory CD4+ T cell cluster in 14 participants at both AHI and ART time points. (B) For the PBMC clusters determined in (A), the expression of host genes identifying these populations is shown, as well as the number of cells with ≥10 HIV-1 transcripts. (C) Three representative cells of viral transcripts were mapped to the HIV-1 genome, showing detection of both full-length virus and active splicing. Gray bars represent coverage of viral sequences from three individual cells, colored bars in these coverage tracks represent single-nucleotide changes from the reference sequence, and colored arches show splicing events. Donor and acceptor splice sites and gene annotation of the HIV-1 reference genome are shown as separate tracks. (D) Frequency of vRNA+ cells (%) in memory CD4+ T cells is shown for each participant during AHI and ART time points. (E) Correlation of frequencies of vRNA+ CD4+ or memory CD4+ T cells obtained from scRNA-seq (red font) with significant clinical parameters (*P < 0.05, **P < 0.01, and ***P < 0.001).

