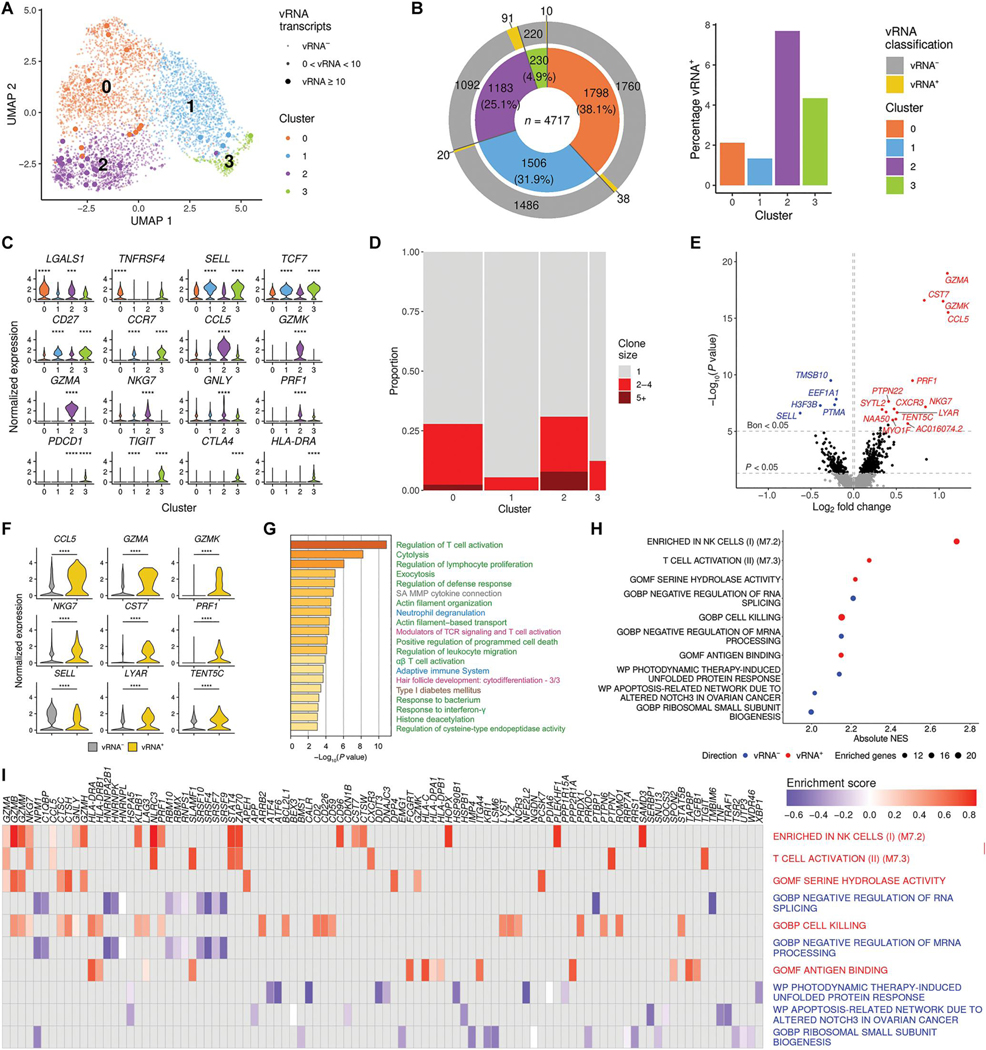
Fig. 3. Host and TCR diversity in memory CD4+ T cells with viral transcripts.
(A) Clustering based on scRNA-seq host transcriptomes of memory CD4+ T cells from one donor identifies four distinct subpopulations. (B) For each cluster in (A), the total number of cells, as well as the number and percentage of cells with viral transcripts, is shown. (C) Gene expression values are plotted for the top DEGs discriminating the four memory CD4+ T cell clusters (***P < 0.001 and ****P < 0.0001). (D) Proportion of expanded TCR clonotypes in the four clusters. Bar widths reflect the number of cells in each cluster. Clone size indicates the number of cells in which the same TCR was detected. (E) Categorical DEGs performed between cells with and without viral transcript in memory CD4+ T cells from all four clusters. Statistical significance and fold change are displayed as a volcano plot, with Bonferroni significant genes indicated in blue (vRNA− direction) or red (vRNA+ direction). Black dots are nominally significant genes. (F) Violin plots showing the expression of some top DEGs from the categorical analysis (all adjusted P < 0.05; ****P < 0.0001). (G and H) The top 100 DEGs shown in (E) were used in pathway analysis identifying associations with the presence of viral transcripts in memory CD4+ T cells (G) and preranked GSEA based on fold change of the genes (H). Pathways in (G) are shown in different colored font representing their source, including Gene Ontology (GO) terms (green), Canonical Pathways (gray), Reactome (blue), WikiPathways (pink), and Kyoto Encyclopedia of Genes and Genomes (KEGG) (brown). In (H) are the top five significant gene sets in both directions. NES, normalized enrichment score. (I) Leading edge analysis with the 10 gene sets from (H).

