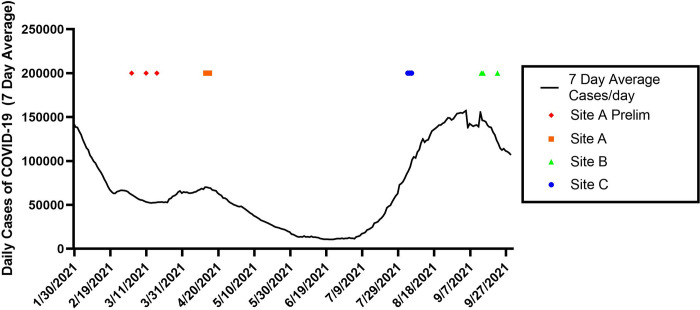
Fig 2.
National 7-day average daily case rates (solid line) obtained from the Center for Systems Science and Engineering (CSSE) at Johns Hopkins University (https://coronavirus.jhu.edu/region/united-states) during sampling for sites A, B and C (noted with colored indicators).

