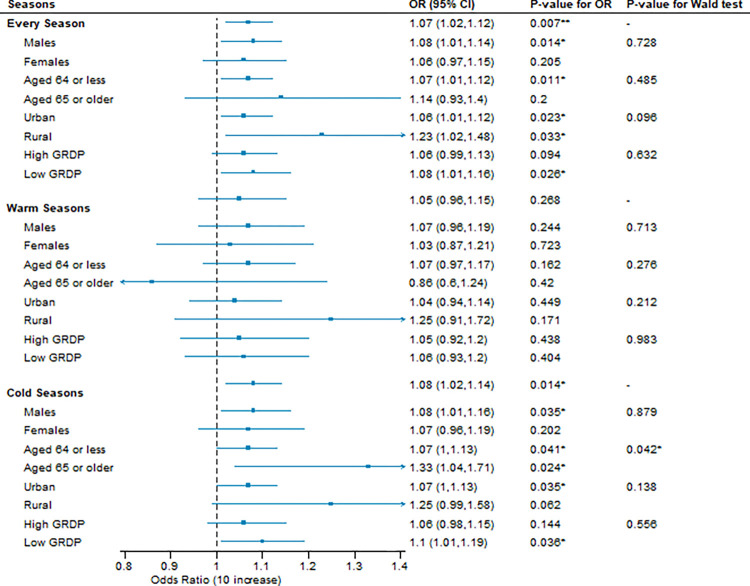
Fig 3. Associations between short-term exposure to PM2.5 (lag 0–2) and violence cases by season and subgroup.
OR: Odds ratio per 10 μg/m3 of PM2.5. A conditional logistic regression model, adjusted for holiday and daily mean temperatures, within a time-stratified case-crossover design, was used to estimate odds ratios and 95% confidence intervals. Wald type test was used to test the effect modification. We classified the study districts (si/gun/gu) into urban (si and gu) and rural (gun) districts. GRDP High and Low areas are separated by a median value.

