. 2024 Dec 17;12:RP88768. doi: 10.7554/eLife.88768

Figure 4. Evidence for colocalisation between amyotrophic lateral sclerosis (ALS) and Alzheimer’s disease (AD) in the Chr6:32.63–32.68 Mb region.

(A) Single-nucleotide polymorphism (SNP)-wise p-value distribution between ALS and AD across Chr6:32.63–32.68 Mb, in which colocalisation analysis found 0.90 posterior probability of the shared-variant hypothesis (see Table 3). (B) (upper) Per-SNP posterior probabilities for being a shared variant between ALS and AD, (lower) positions of HGNC gene symbols nearby to the 95% credible SNPs. Posterior probabilities for being a shared-variant sum to 1 across all SNPs analysed and are predicated on the assumption that a shared variant exists; 95% credible SNPs are those spanned by the top 0.95 of posterior probabilities. The x-axis for Panel B is truncated by the base pair range of the credible SNPs and genomic positions are based on GRCh37.

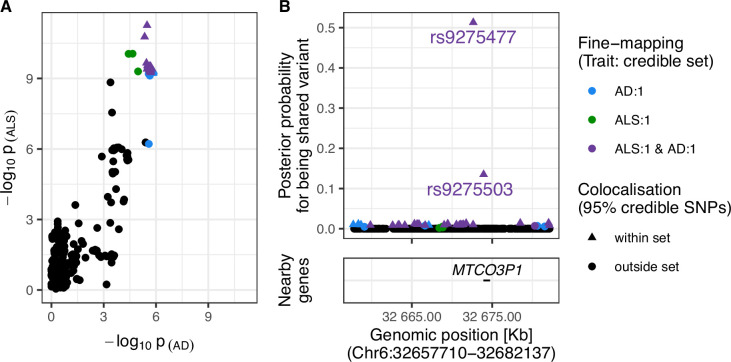
Figure 4.

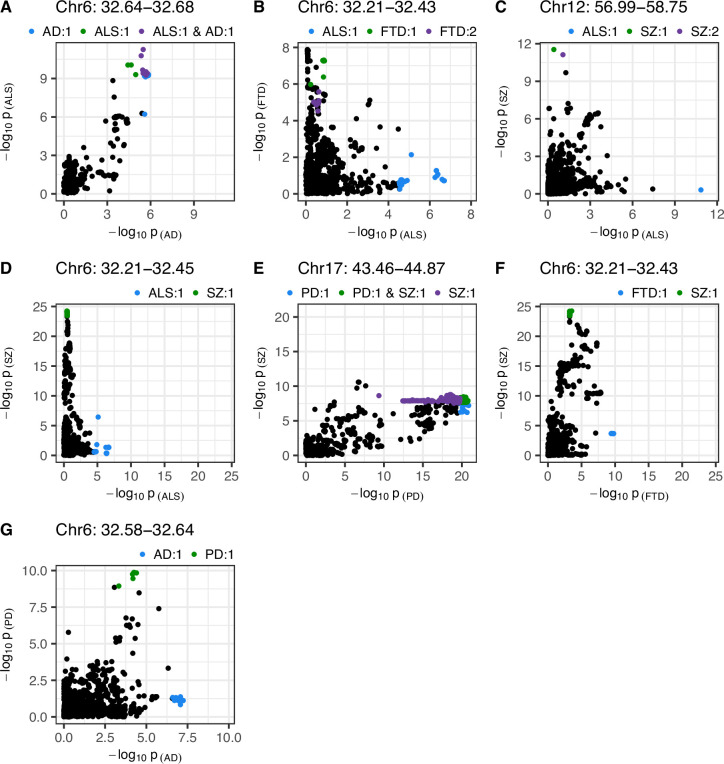
Figure 4—figure supplement 1. Single-nucleotide polymorphism (SNP)-wise p-value distribution between trait pairs in comparisons where colocalisation analysis suggested a causal variant in both traits.

Figure 4—figure supplement 1.

Colocalisation analysis supported the shared-variant hypothesis for the comparison in (A), and the presence of distinct variants for each trait in (B-G) (see Table 3). Colouring indicates fine-mapping credible sets assigned to SNPs across the traits compared; the legend above each panel is in the format 'Trait: credible set number'. The genomic position range shown above each panel is in Mb. AD = Alzheimer’s disease, ALS = amyotrophic lateral sclerosis, FTD = frontotemporal dementia, PD = Parkinson’s disease, SZ = schizophrenia.
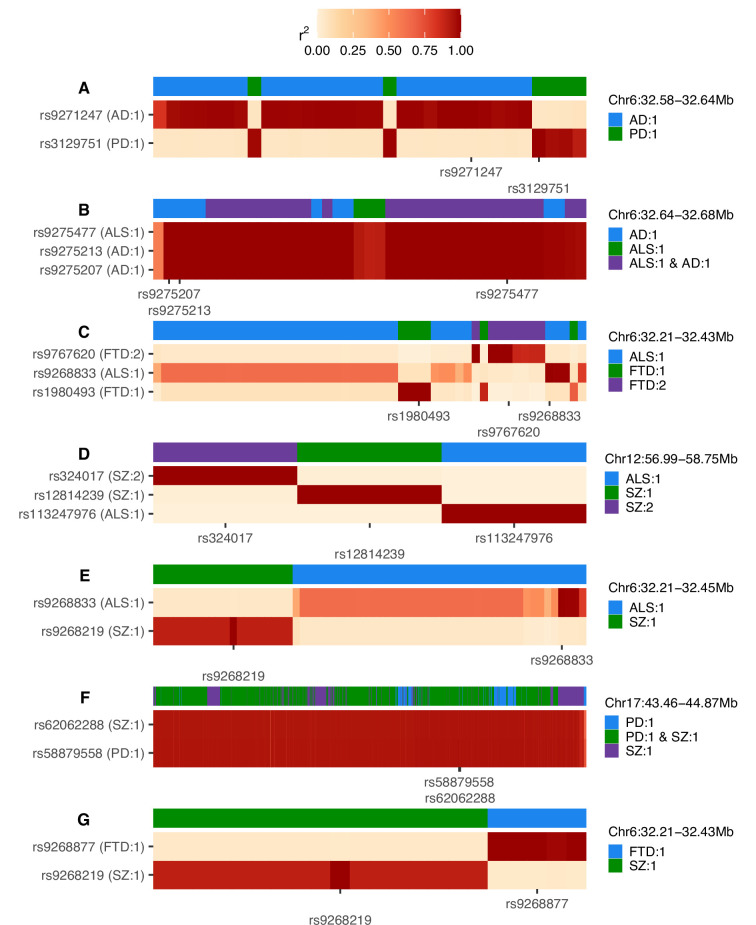
Figure 4—figure supplement 2. Heatmaps of linkage disequilibrium (LD) in the 1000 Genomes European reference population across variants assigned to any credible set during univariate fine-mapping of trait pairs (A-G).

Figure 4—figure supplement 2.

LD is shown relative to the single-nucleotide polymorphisms (SNPs) with the highest posterior inclusion probability (PIP) for each credible set, displaying all top PIP SNPs when ties occur. The y-axis splits by top PIP SNPs and the x-axis displays SNPs ordered by genomic position, marking only the positions of the top PIP SNPs. Credible set assignments for each variant are shown in the colour bar at the top of each panel and for the top PIP SNPs in the y-axis label; these are annotated in the format: ‘trait: credible set number’. The genomic range indicated at the top right of each panel refers to the positions spanned across all SNPs analysed and is in Mb. AD = Alzheimer’s disease, ALS = amyotrophic lateral sclerosis, FTD = frontotemporal dementia, PD = Parkinson’s disease, SZ = schizophrenia.
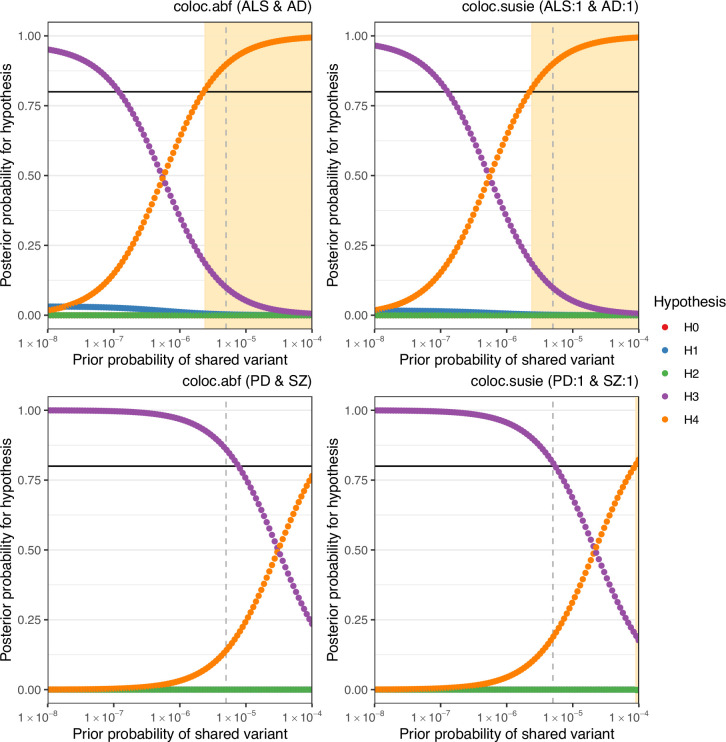
Figure 4—figure supplement 3. Sensitivity of colocalisation analysis to the prior probability of a shared variant between traits.

Figure 4—figure supplement 3.

The upper panels display analysis at Chr6:32629240–32682213 between amyotrophic lateral sclerosis (ALS) and Alzheimer’s disease (AD). The lower panels are for Chr17:43460501–44865832 between Parkinson’s disease (PD) and schizophrenia (SZ). Panels labelled ‘coloc.abf’ display analysis across all single-nucleotide polymorphisms (SNPs) in the region and ‘coloc.susie’ indicates analysis across the SNPs within the pair of fine-mapping credible sets identified across trait pairs. Plot points indicate posterior probability of each hypothesis (H0 = no causal variant for either trait, H1 = variant causal for the trait one, H2 = variant causal for trait two, H3 = distinct causal variants for each trait, H4 = a shared causal variant between traits), according to the prior probability of H4. The vertical hatched line indicates the prior H4 probability defined for the reported analysis; the black horizontal line indicates the defined threshold for acceptance of H4: posterior H4 probability >0.8. Cream shading of the plot area indicates prior H4 probabilities which yield a posterior probability of H4 above the threshold.