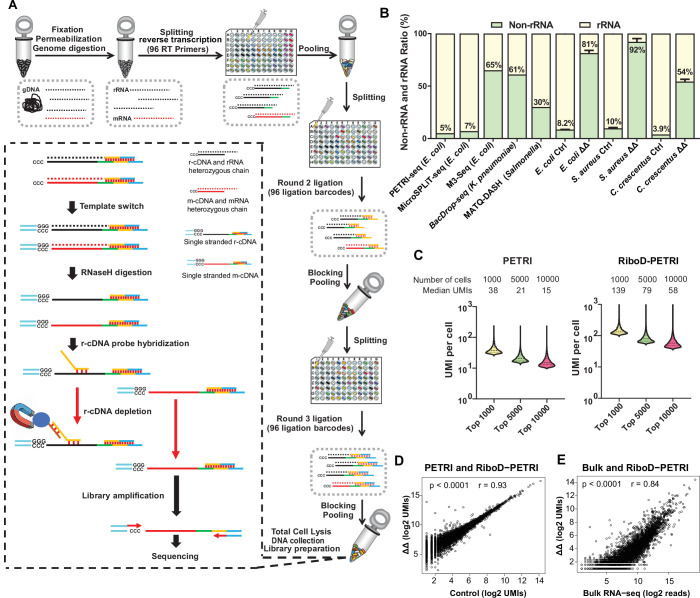
Figure 1. Development of RiboD-PETRI and validation of its technical performance in studying population heterogeneity.
(A) Graphic summary of the RiboD-PETRI method illustrating the incorporation of RiboD after cell pooling and lysis in PETRI-seq. The RiboD protocol is represented by the dashed-line box. In this box, first, we perform template-switching oligonucleotides (TSOs) in the mixture of heterozygous chain, then we remove the RNA strand using RNaseH, at this point the system contains r-cDNA and m-cDNA single-stranded mixture. Then we add the r-cDNA probe, which specifically binds to the r-cDNA. The probes are then bound to magnetic beads, allowing the r-cDNA-probe-bead complexes to be separated from the rest of the library. And then we remove the r-cDNA that is attached to the probe by Streptavidin magnetic beads. We then performed amplification of the libraries and sent them for sequencing. We designed separate probe sets for Escherichia coli, Caulobacter crescentus, and Staphylococcus aureus. Each set was specifically constructed to be reverse complementary to the r-cDNA sequences of its respective bacterial species. This species-specific approach ensures high efficiency and specificity in rRNA depletion for each organism. (B) Comparison of non-rRNA (tRNA, mRNA, and other non-rRNA) and rRNA unique molecular identifier (UMI) counts ratio among different bacterial scRNA-seq methods. Data from PETRI-seq (E. coli), MicroSPLIT-seq (E. coli), M3-seq (E. coli) cited from previous studies. Error bars represent standard deviations of biological replicates. The ‘ΔΔ’ label represents the RiboD-PETRI protocol. The ‘Ctrl’ label represents the classic PETRI-seq protocol we performed. (C) Comparison of UMI counts per cell between RiboD-PETRI (Supplementary file 7) and PETRI (Supplementary file 8) at the same unsaturated sequencing depth. (D) Assessment of the effect of rRNA depletion on transcriptional profiles. The Pearson correlation coefficient (r) of UMI counts per gene (log2 UMIs) between RiboD-PETRI (Supplementary file 7) and PETRI (Supplementary file 9) was calculated for 3790 out of 4141 total genes, excluding those with zero counts in either library. Each point represents a gene. (E) Evaluation of the correlation between RiboD-PETRI (Supplementary file 7) data and bulk RNA-seq (Supplementary file 10) results. The Pearson correlation coefficient (r) of UMI counts per gene (log2 UMIs) among RiboD-PETRI data and the reads per gene (log2 reads) of bulk RNA-seq data was calculated for 3814 out of 4141 total genes, excluding those with zero counts in either library. Each point represents a gene. All data presented in C, D, E were from our own sequencing experiments.


