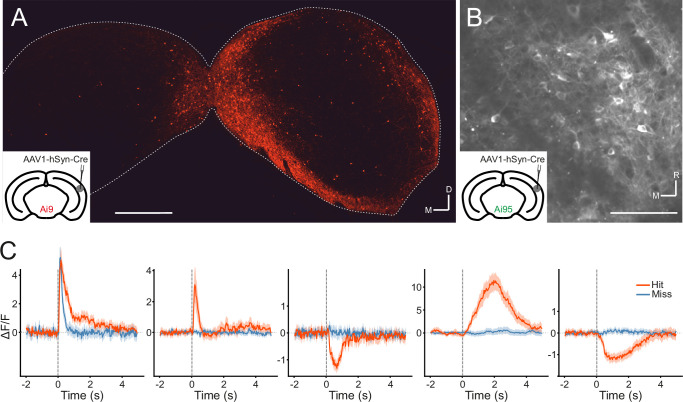
Figure 4. Transsynaptic targeting and two-photon calcium imaging of corticorecipient inferior colliculus (IC) shell neurons.
(A) Coronal section of the left and right IC of a tdTomato-reporter (Ai9) mouse in which AAV1.hSyn.Cre.WPRE had been injected into the right auditory cortex three weeks before perfusion. The transsynaptically transported virus drove the expression of Cre recombinase and tdTomato in neurons that receive input from the auditory cortex, including the corticorecipient neurons in the IC. tdTomato-labeled neurons were predominantly found in the shell of the ipsilateral (right) IC. Scale bar, 500 µm. (B) In vivo two-photon micrograph taken approximately 100 µm below the dorsal surface of the right IC of a GCaMP6f-reporter mouse (Ai95D) in which GCaMP6f expression had been driven in corticorecipient IC neurons by injection of AAV1.hSyn.Cre.WPRE into the right auditory cortex. See Figure 4—video 1 for the corresponding video recording. Scale bar, 100 µm. (C) Example average response profiles of five corticorecipient IC neurons for different trial outcomes. Vertical line at time 0 s indicates the time of click presentation. Shaded areas represent 95% confidence intervals.


