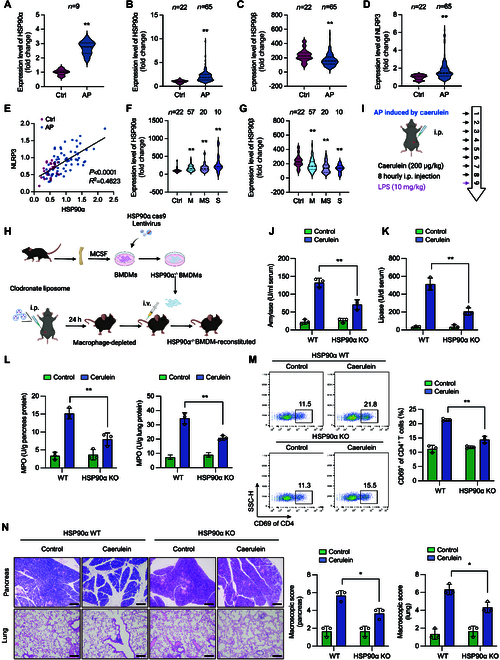
Fig. 8.

HSP90α plays a critical role in the pathological process of AP. (A) GEO (Gene Expression Omnibus) database (GSE3644) of HSP90α expression profiles between cerulein-induced mice AP models and healthy control. (B to D) GEO database (GSE194331) of (B) HSP90α, (C) HSP90β, and (D) NLRP3 expression profiles between AP patients and healthy control. (E) Correlation between HSP90α and NLRP3 expression level in AP patients and healthy control. M, mild AP; MS, moderately severe AP; S, severe AP. (F and G) GEO database (GSE194331) of (F) HSP90α and (G) HSP90β expression profiles among patients with varying degrees of AP and healthy controls. (H) Schematic of the depletion and reconstitution of mouse macrophages. (I to N) AP was induced by cerulein stimulation in mice. (I) Schematic diagram illustrating the establishment of mouse AP model. (J) Serum amylase and (K) lipase activities were determined to reflect pancreatic damage and disease severity. (L) MPO level in lungs and pancreases was analyzed to reflect the severity of systemic inflammation. (M) Representative flow cytometry plots of CD4+ CD69+ T cells in spleen. (N) Representative hematoxylin and eosin (H&E) staining of mouse pancreas and lung tissues. Scale bar, 100 μm. Data are presented as mean ± SEM of 3 mice in each group. *P < 0.05, **P < 0.01 versus as indicated.
