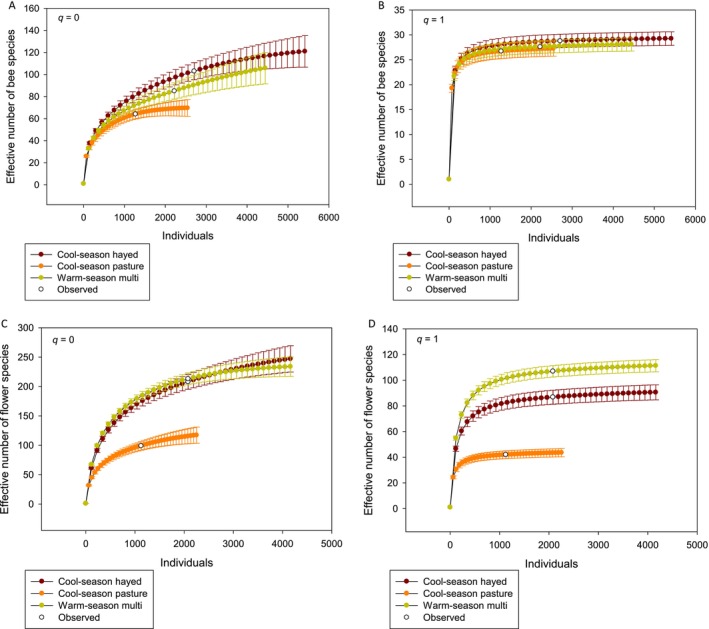
FIGURE 4.

Effective number of bee species at q = 0 (A) and q = 1 (B), and effective number of flower species at q = 0 (C) and q = 1 (D) as a function of number of individuals observed at 37 National Park Service units in the United States in 2021 and 2022 were pooled. Values above the observed number of species are extrapolated and those below are rarefied.
