
FIGURE 3.
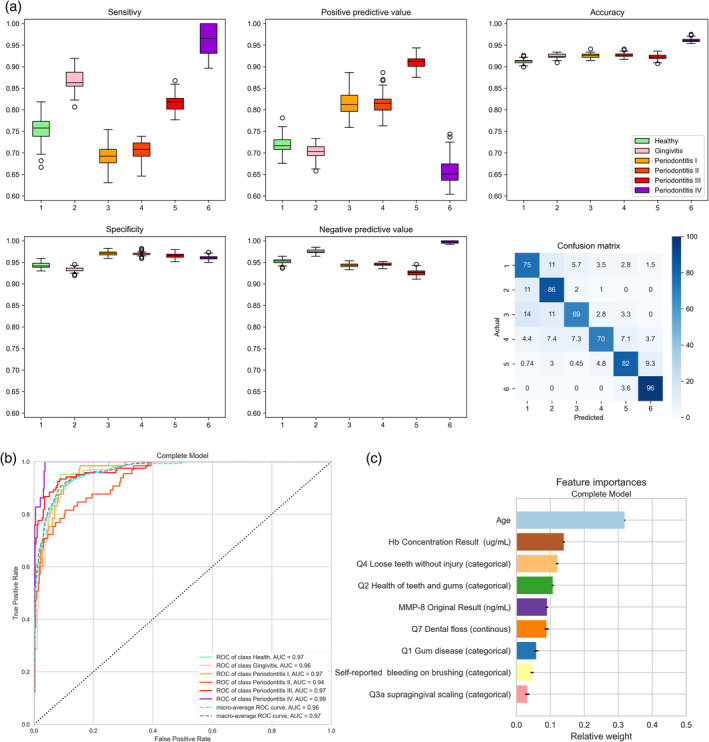
Accuracy of the six‐class prediction of periodontal health, gingivitis and stages I–IV periodontitis using the random forest classifier. (a) Periodontal health (1, green), gingivitis (2, pink), stage I periodontitis (3, orange), stage II periodontitis (4, light red), stage III periodontitis (5, darker red) and stage IV periodontitis (6, purple). The figure shows box plots of sensitivity (upper left diagram), specificity (lower left), positive predictive value (upper centre), negative predictive value (lower centre) and accuracy (upper right). The lower right diagram shows the confusion matrix plotting the frequency of predicted versus actual diagnosis. Values were obtained by averaging 100 runs. (b) Receiver‐operating‐curves plotting true positive rates against false positive rates and the area under the ROC (AUROC) for the six‐class random forest diagnosis obtained using the ‘yellowbrick’ package in Python (see text for details). (c) Diagrammatic representation of the relative influence of the multiple factors in the six‐class random forest classification. Values were obtained by averaging 100 runs. Hb, haemoglobin; MMP‐8, matrix metalloproteinase‐8.