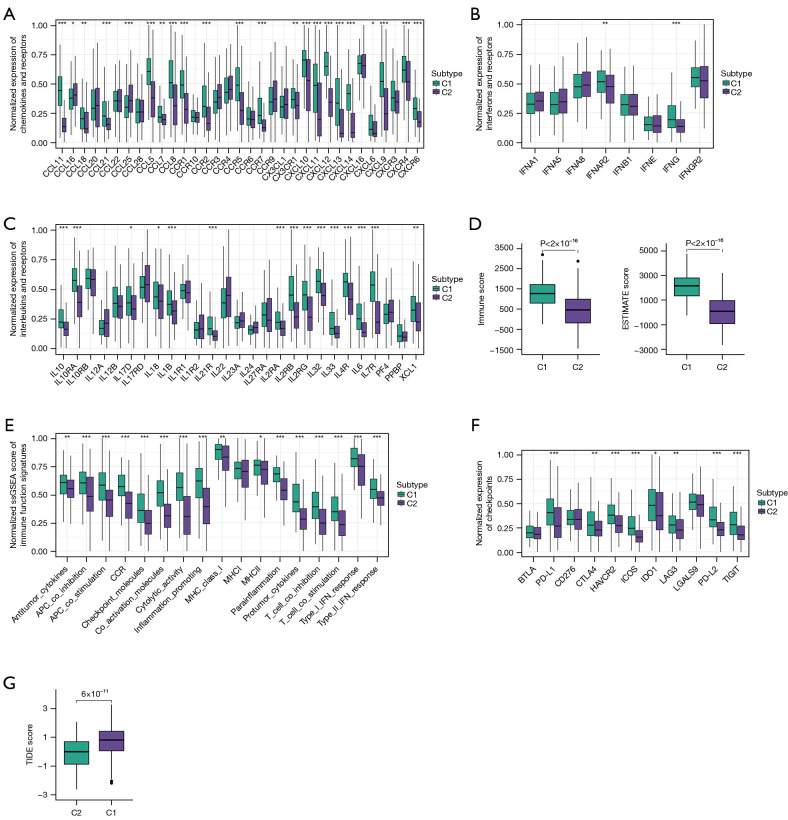
Figure 2.
Immune and functional landscapes of two clusters. (A) Box plots comparing expression levels of chemokines and receptors in two clusters. (B) Box plots comparing expression levels of interferons and receptors in two clusters. (C) Box plots comparing expression levels of interleukins and receptors in two clusters. (D) Box plots comparing immune and ESTIMATE score in two clusters. (E) Box plots comparing ssGSEA score for immune function signatures between two clusters. (F) Box plots comparing expression levels of checkpoints in two clusters. (G) Box plots comparing TIDE score in two clusters. Wilcoxon test: *, P<0.05; **, P<0.01; ***, P<0.001. ESTIMATE, Estimation of STromal and Immune cells in MAlignant Tumor tissues using Expression data; TIDE, Tumor Immune Dysfunction and Exclusion; ssGSEA, single-sample gene set enrichment analysis.

