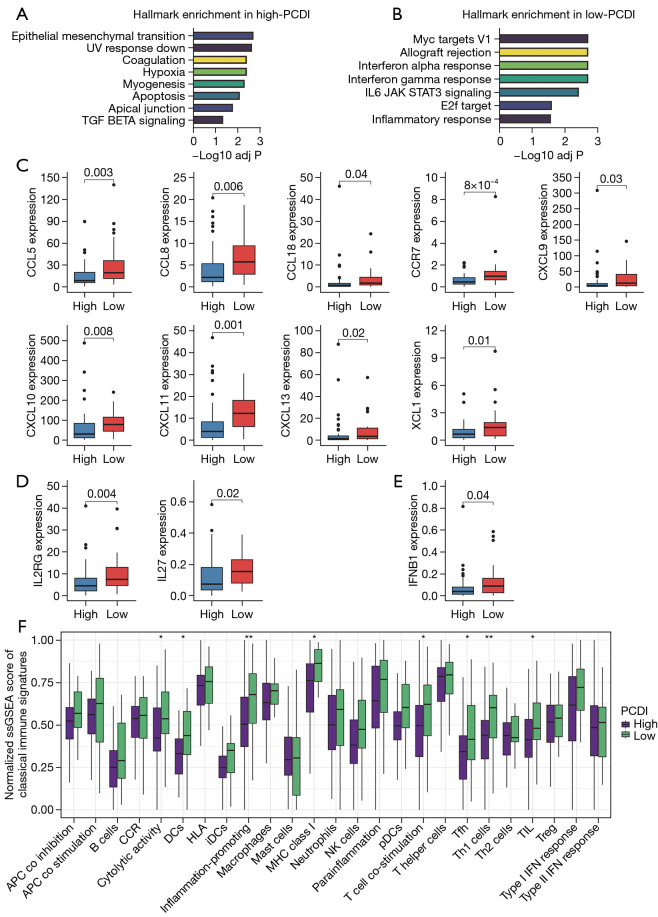
Figure 5.
Immune and functional landscapes of low- and high-PCDI groups. (A) GSVA enrichment of HALLMARK pathways in high-PCDI groups. (B) GSVA enrichment of HALLMARK pathways in low-PCDI groups. (C) Box plots comparing expression levels of chemokines and receptors in high- vs. low-PCDI groups. (D) Box plots comparing expression levels of interleukins and receptors in high- vs. low-PCDI groups. (E) Box plots comparing expression levels of Interferon IFNB1 in high- vs. low-PCDI groups. (F) Box plots comparing single-sample gene set enrichment analysis (ssGSEA) scores for classical immune function signatures between low- and high-PCDI groups. Wilcoxon test: *, P<0.05; **, P<0.01. PCDI, programmed cell death index; GSVA, gene set variation analysis.

