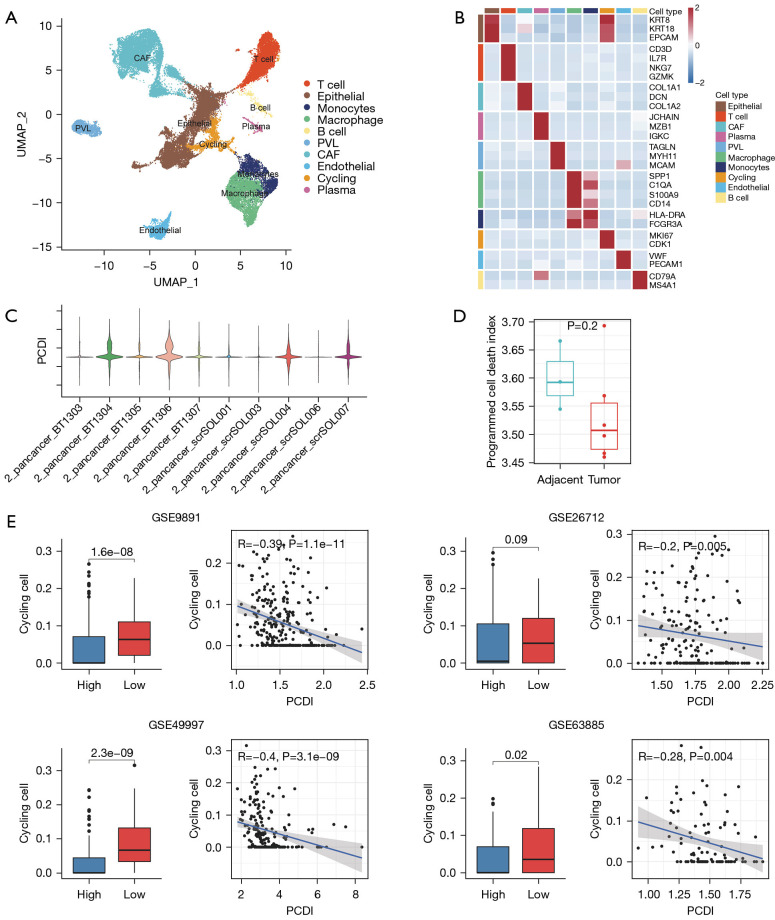
Figure 6.
PCD-related immune landscapes at single-cell resolution. (A) UMAP plot showing the composition of seven main cell types derived from thyroid carcinoma tissues. (B) Heatmap plot displaying the expression of classical markers for each of the ten cell types. (C) The PCDI for each OC samples. (D) Box plots comparing PCDI in adjacent- vs. tumor tissues. (E) Correlation between cycling cells calculated by BisquRNA and PCDI in GSE9891, GSE26712, GSE49997 and GSE63885 cohorts. UMAP, Uniform Manifold Approximation and Projection; PCD, programmed cell death; PCDI, programmed cell death index; OC, ovarian cancer; CAF, cancer associated fibroblast; PVL, perivascular-like cell.

