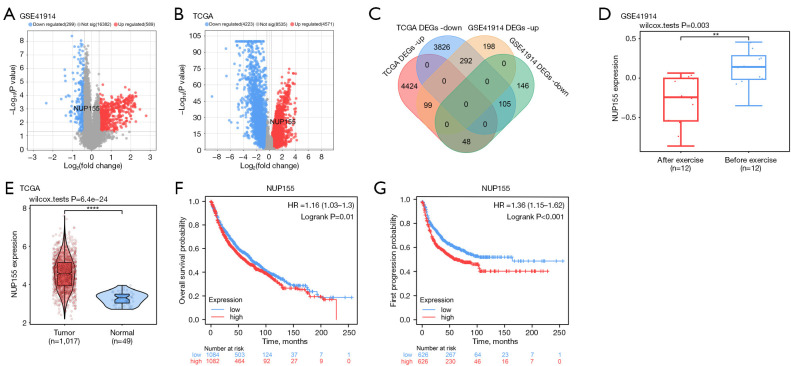
Figure 1.
Differential expression and prognostic significance of NUP155 in NSCLC-related datasets. (A,B) DEGs screening of the GSE41914 dataset and TCGA-NSCLC dataset. Blue represents the downregulated DEGs, and red represents the upregulated DEGs. (C) Cross-analysis of upregulated and downregulated DEGs in the GSE41914 and TCGA-NSCLC datasets for obtaining the overlapping genes. (D) Boxplot showing the expression level of NUP155 in pre-exercise and postexercise samples in the GSE41914 dataset. (E) Boxplot showing the expression level of NUP155 in NSCLC samples and normal samples in TCGA dataset. (F) Kaplan-Meier survival curve showing the patients’ overall chance of survival from NSCLC. The red line represents high NUP155 expression, and the blue line represents low NUP155 expression. (G) Kaplan-Meier survival curve of first progression probability of patients with NSCLC. The red line represents high NUP155 expression, and the blue line represents low NUP155 expression. **, P<0.01; ****, P<0.0001. NSCLC, non-small cell lung cancer; DEG, differentially expressed gene; TCGA, The Cancer Genome Atlas.

