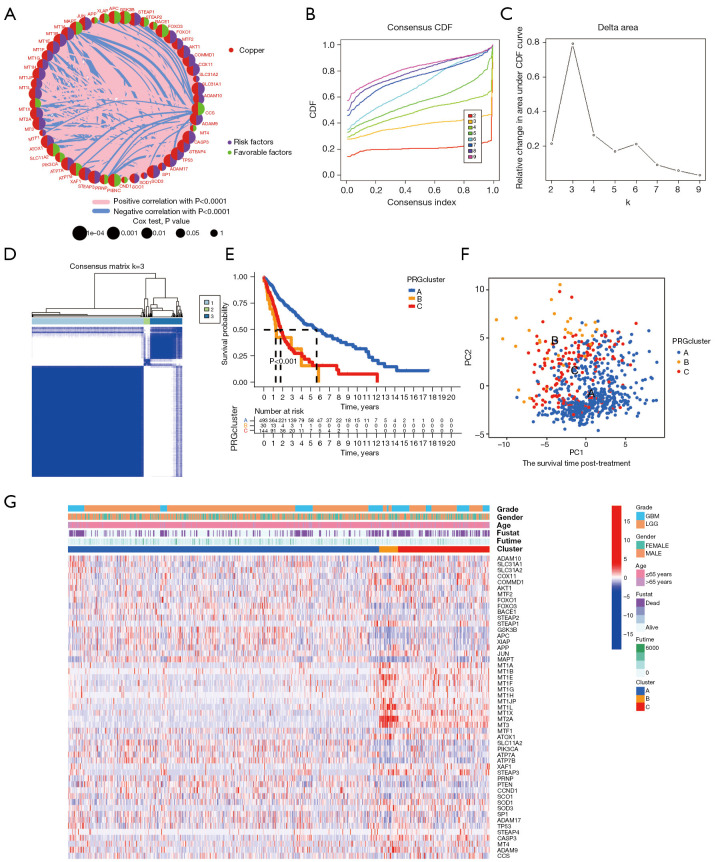
Figure 2.
An unsupervised cluster analysis was used to divide the glioma patients into subclusters. (A) Circos plot showing the relationship between copper homeostasis-related gene expression and glioma prognosis in TCGA cohort. (B) Consensus CDF curves of TCGA cohort. (C) The delta region under the CDF curve displays the variation in cumulative risk as the number of consensus clustering matrices increases, and it has been demonstrated that three clusters are optimal (k=3). (D) The 669 patients were divided into three clusters according to the consensus clustering matrix (k=3). (E) Kaplan-Meier curves were utilized to compare the survival profiles of the three clusters, along with the time-dependent numbers at risk within each cluster. (F) PCA plots for three clusters in TCGA cohort. (G) Heatmap of the associations between the clinicopathologic features and the three gene clusters. (Blue to red indicates increased gene expression). TCGA, The Cancer Genome Atlas; CDF, cumulative distribution function; PCA, principal component analysis; LGG, low-grade glioma; GBM, glioblastoma.

