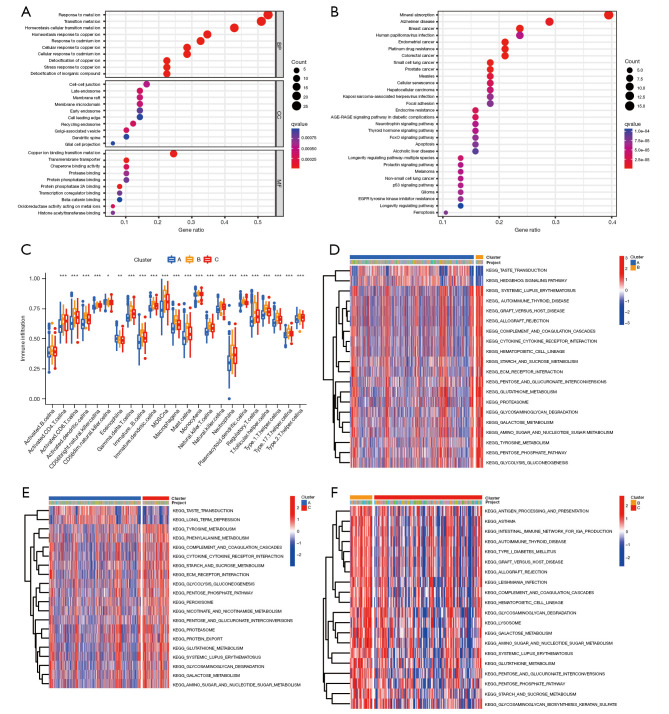
Figure 3.
Functional enrichment analysis and tumor microenvironment immune cell infiltration analyses. (A) The enrichment of the GO functions. (B) The KEGG pathways. (C) Comparison of immune infiltration among the three clusters in TCGA cohort (*, P<0.05; **, P<0.01; ***, P<0.001). (D-F) Pair-wise GSVA of the two clusters. BP, biological process; CC, cellular component; MF, molecular function; TCGA, The Cancer Genome Atlas; GO, Gene Ontology; KEGG, Kyoto Encyclopedia of Genes and Genomes; GSVA, gene set variation analysis.

