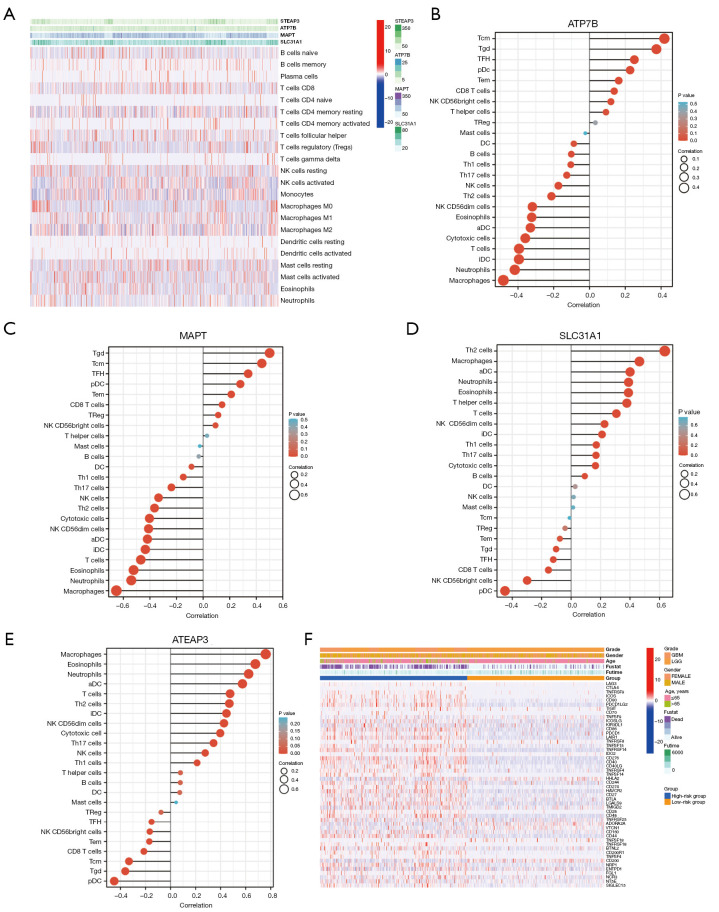
Figure 7.
Tumor immune microenvironment analyses. (A) Heatmap. (B) Correlation analyses between immune cell subpopulations and ATP7B. (C) Correlation analyses between immune cell subpopulations and MAPT. (D) Correlation analyses between immune cell subpopulations and SLC31A1. (E) Correlation analyses between immune cell subpopulations and ATEAP3. (F) Heatmaps of the 27 immune checkpoint profiles in the high- and low-risk groups. MAPT, microtubule-associated protein tau; ATP7B, ATPase beta; SLC31A1, solute carrier family 31 member A1; ATEAP3, ArsC family C-type aminothiol-independent, acidic phosphatase 3; LGG, low-grade glioma; GBM, glioblastoma.

