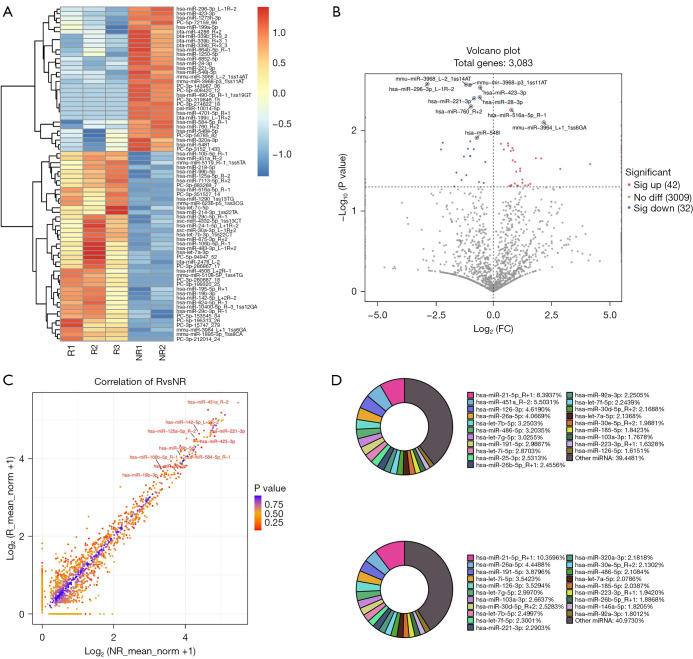
Figure 2.
Differential expression analyses and gene expression signature for the responder (R) and non-responder (NR) groups. (A) The panel of exosomal miRNAs to identify potential responders to treatment in advanced GC patients. (B) Volcano plot depicting differential miRNA expression between the R and NR groups. Each point represents a miRNA, with red points indicating significantly upregulated miRNAs (n=42), blue points indicating significantly downregulated miRNAs (n=32), and gray points indicating non-significant changes. The x-axis represents the log2 fold change in miRNA expression between the R and NR groups, while the y-axis represents the −log10 adjusted P value. (C) Correlation plot showing the expression levels of miRNAs in the two groups. (D) Top 20 miRNAs in the R group (upper panel) and NR group (lower panel). FC, fold change; miRNA, microRNA; GC, gastric cancer.

