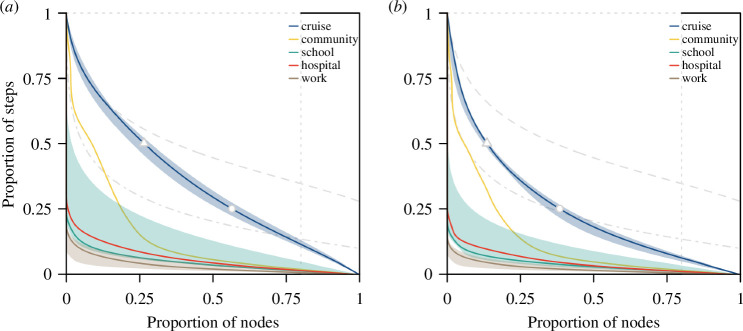
Figure 5.
Proportion individuals who are potential ‘superspreaders’ or drive superspreading events in respective networks, estimated based on (a) contact episodes or (b) contact duration. For reference, grey lines represent homogeneous static network (dotted), homogeneous dynamic network in 25 time steps (dashed) and overdispersed dynamic network in 10 time steps (dot dashed). Cut-off marks for the proportion of individuals in the cruise networks who were highly connected for more than half the total number of time steps (triangle) and those who were highly connected for less than a quarter of the time (dot) as shown.

