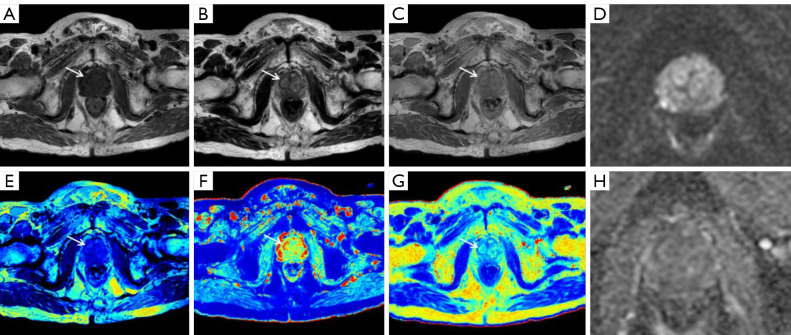
Figure 3.
Prostate MR images of an 84-year-old man with PSA level of 7.28 ng/mL. A lesion was found located in the right TZ (white arrow), which was pathologically confirmed to be benign prostatic hyperplasia. (A-C) T1-, T2- and PD-weighted images were obtained from SyMRI. Both T2- and PD-weighted images show a slightly hyperintense signal in the right TZ. Both (D) axial diffusion-weighted image (b=1,500 s/mm2) and ADC map (H) demonstrate no evidence of diffusion restriction with an intermediate-signal intensity at the focus point corresponding to the location of the abnormal signal on the SyMRI scan. And the mean ADC value measured by the two radiologists was 1,323.78×10−6 mm2/s. (E-G) SyMRI-derived T1, T2 and PD maps indicate that the mean T1, T2, and PD values measured by the two radiologists were 1,589.05 ms, 97.23 ms and 85.20 pu, respectively. MR, magnetic resonance; PSA, prostate-specific antigen; TZ, transition zone; SyMRI, synthetic magnetic resonance imaging; PD, proton density; ADC, apparent diffusion coefficient.

