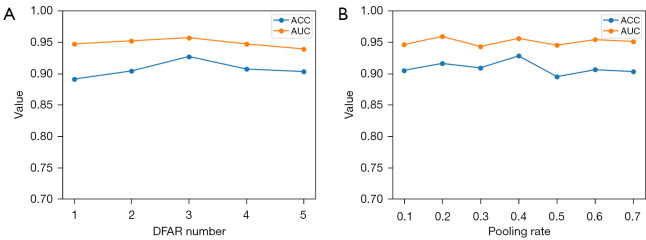
Figure 10.
Effect of number of DFAR modules and graph pooling rate on performance. (A) The model achieved optimal performance when the number of DFAR modules was set to 3. (B) The model achieved optimal performance when the graph pooling rate was set to 0.4. ACC, accuracy; AUC, area under the curve; DFAR, discriminative features by focusing on atrophic regions.

