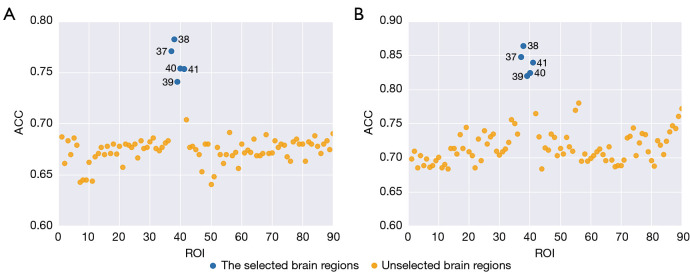
Figure 3.
The classification accuracy visualization of the 90 brain regions between the two strategies of (A) voxel intensities and (B) radiomic features. In both strategies, the same five brain regions (blue dots) including the left hippocampus [37], right hippocampus [38], left parahippocampal gyrus [39], right parahippocampal gyrus [40], and left amygdala [41] exhibited superior performance compared to the other methods regardless the classification accuracy threshold. ROI, region of interest; ACC, accuracy.

