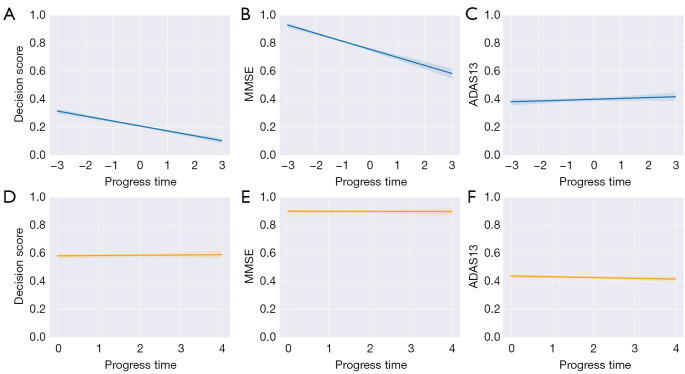
Figure 8.
Longitudinal trajectory analysis of MCI progression in the ADNI cohort. (A-C) pMCI progression trajectories of the decision score, MMSE, and ADAS13. (D-F) sMCI progression trajectories of the decision scores, MMSE, and ADAS13. (A-C) In the pMCI group, the decreased confidence of the decision score and MMSE or the increased confidence ADAS13 in pMCI was equivalent to the increase in confidence of AD prediction. (D-F) In the sMCI group, the decision scores, MMSE, and ADAS13 remained relatively stable. The “0” in (A-C) represents the time point of AD onset, “−1”, “−2”, “−3”, “1”, “2”, and “3” represent data from participants 12, 24, and 36 months before and after onset. The “0”, “1”, “2”, “3”, and “4” in (D-F) represent sMCI baseline data and participant data at 12, 24, 36, and 48 months after diagnosis of sMCI. ADAS13, Alzheimer’s Disease Assessment Scale 13; MMSE, Mini-Mental State Examination; MCI, mild cognitive impairment; AD, Alzheimer’s disease; ADNI, Alzheimer’s Disease Neuroimaging Initiative; pMCI, progressive mild cognitive impairment; sMCI, stable mild cognitive impairment.

