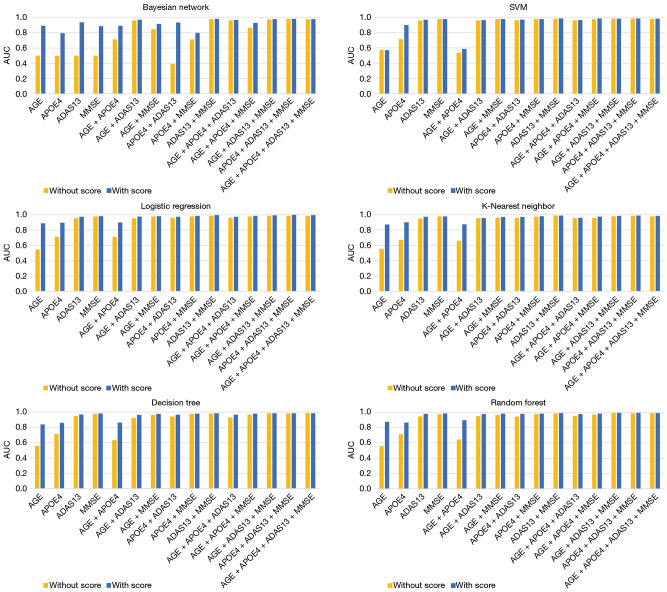
Figure 9.
Histogram of the impact of decision scores on the diagnostic performance of clinical indicators. The feature vectors consisting of AGE, ADAS13, MMSE, and APOE4 are based on the performance histogram of six machine learning models for AD diagnosis. Orange represents the decision score not considered, and the blue represents the decision score considered. AUC, area under the curve; SVM, support vector machine; SVM, support vector machine; AD, Alzheimer’s disease; ADAS13, Alzheimer’s Disease Assessment Scale 13; MMSE, Mini-Mental State Examination; APOE4, apolipoprotein E4.

