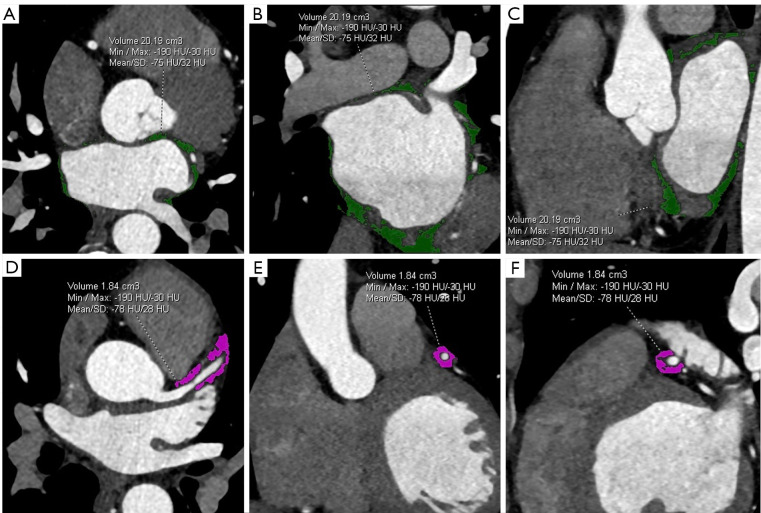
Figure 2.
Measurement of the volume and attenuation of epicardial adipose tissue in the left atrium (LA-EATV and LA-EAT attenuation, respectively) and the volume and attenuation of the perivascular adipose tissue around the left anterior descending artery (LAD-FAI and LAD-V, respectively). The green area represents the LA-EAT region in the (A) axial, (B) coronal, (C) and sagittal planes. The purple area represents the perivascular adipose tissue around the LAD in the (D) axial, (E) coronal, (F) and sagittal planes. HU, Hounsfield unit; SD, standard deviation; LA-EATV, volume of the left atrial epicardial adipose tissue; LA-EAT, left atrium epicardial adipose tissue; LAD-FAI, left anterior descending artery fat attenuation index; LAD-V, adipose volume surrounding the left anterior descending artery.

