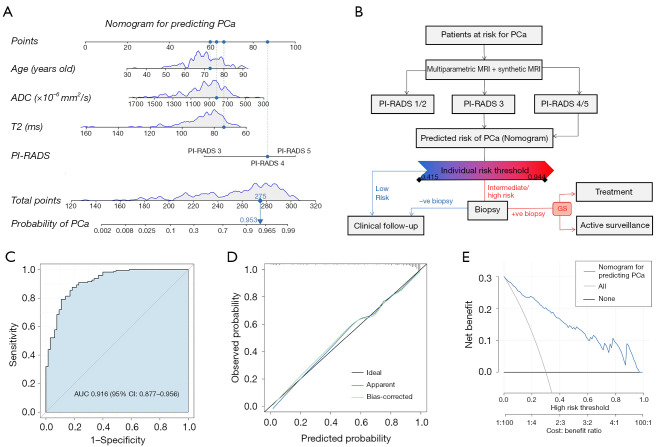
Figure 3.
Nomogram for the detection of PCa and performance evaluation in the training cohort. (A) Nomogram; (B) biopsy strategy combining the nomogram; (C) receiver operating characteristic curve; (D) calibration curve; (E) decision curve. Instructions: the value for each factor (age, T2 value, ADC value, PI-RADS score) corresponds to the point vertically above the below scale. The values are added together to determine the total points, which then correspond to the estimated risk of PCa shown on the scale at the bottom. PCa, prostate cancer; ADC, apparent diffusion coefficient; T2, transverse relaxation time; PI-RADS, Prostate Imaging Reporting and Data System; MRI, magnetic resonance imaging; GS, Gleason score; AUC, area under the curve; CI, confidence interval.

