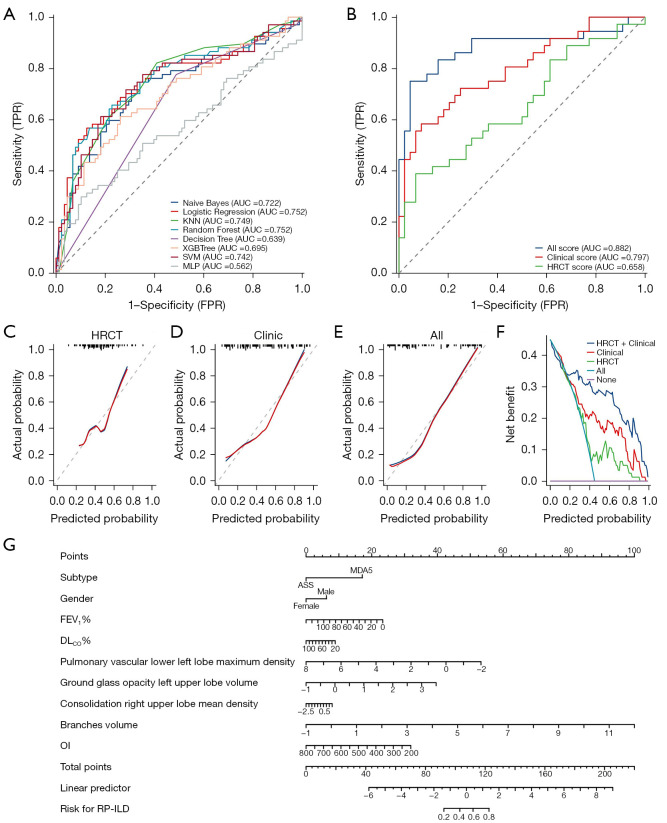
Figure 4.
Performance of a series of models for predicting RP-ILD. (A) ROC of eight machine learning models; (B) ROC of logistic regression; (C-E) calibration curve of logistic regression; (F) clinical decision curve of logistic regression; (G) prognostic nomogram. TPR, true positive rate; AUC, area under the ROC curve; KNN, k-nearest neighbor; SVM, support vector machine; MLP, multilayer perceptron; FPR, false positive rate; HRCT, high-resolution computed tomography; ASS, antisynthetase syndrome; MDA5, melanoma differentiation-associated protein 5; FEV1%, forced expiratory volume in 1 second as a percentage of the predicted value; DLCO%, diffusing capacity of the lung for carbon monoxide as a percentage of the predicted value; OI, oxygenation index; RP-ILD, rapidly progressive interstitial lung disease; ROC, receiver operating characteristic.

