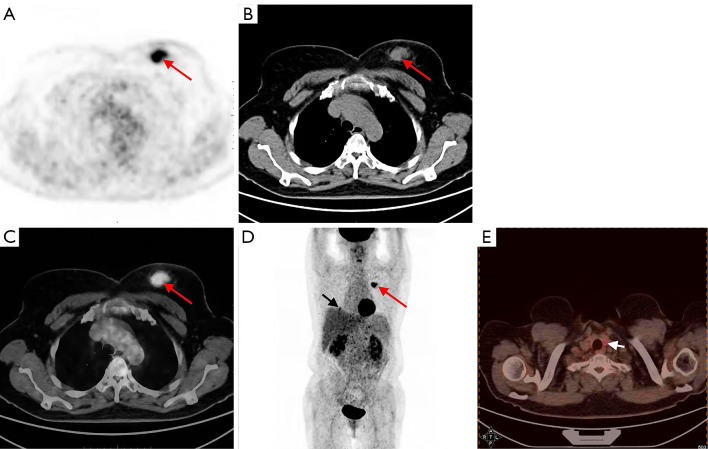
Figure 2.
FDG PET/CT scan showing hypermetabolic activity in the breast, lung, and thyroid. (A) PET image of the breast metastasis. (B) CT image of the breast metastasis. (C) Fused PET/CT image of the breast metastasis. (D) Whole-body PET MIP image showing lung metastasis and breast metastasis. (E) Fused PET/CT image of the thyroid recurrence. FDG PET/CT revealed a hypermetabolic nodule (2.8 cm × 2.0 cm) with SUVmax of 7.08 in the upper internal quadrant of the left breast [red arrows in (A), (B), (C), and (D)], along with hypermetabolic nodules in the right lower lung [black arrow in (D)] and the thyroid gland [white arrow in (E)]. FDG, fluorodeoxyglucose; PET, positron emission tomography; CT, computed tomography; SUVmax, maximum standardized uptake value; MIP, maximum intensity projection.

