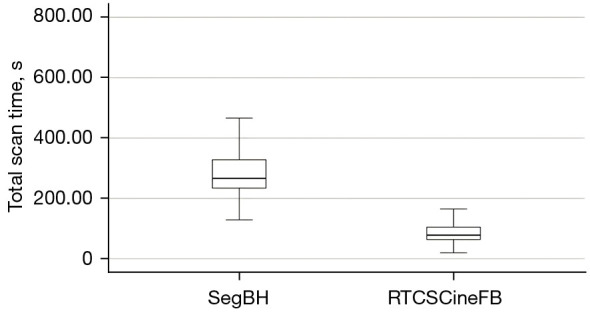
Figure 2.

Box plots displaying the mean scan duration in seconds for SegBH and RTCSCineFB images. The upper and lower bounds of the box plot represent the maximum and minimum values; lines indicate the 25th percentile, median, and 75th percentile (in ascending order). SegBH, breath-hold segmented cine; RTCSCineFB, real-time compressed sensing cine with free breathing.
