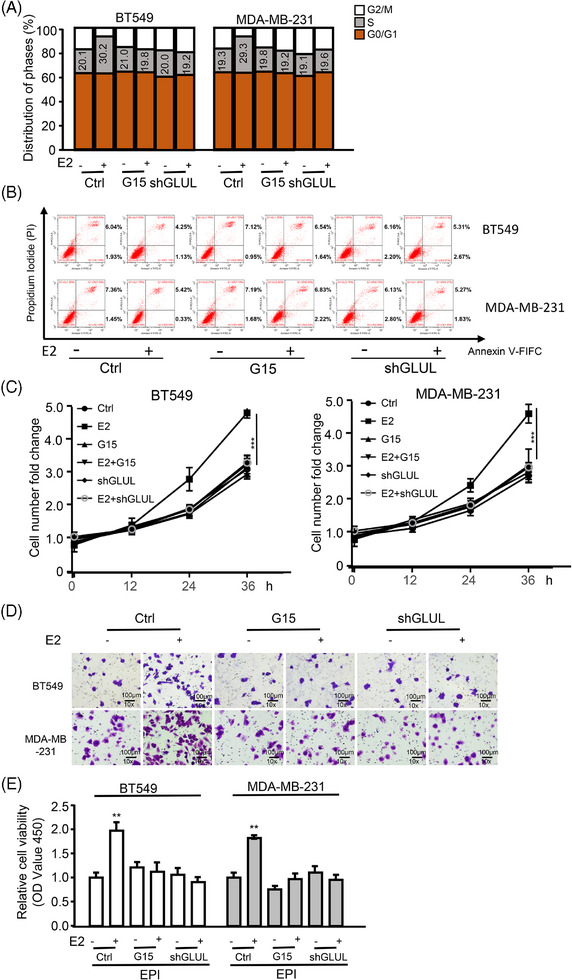
FIGURE 3.

GPER‐induced glutamine in CAFs fuels TNBC malignant potential. (A–E) BT549 and MDA‐MB‐231 cells were treated with indicated reagents (e.g., E2 [100 nM, 12 h], G15 [100 nM, 12 h]), or subjected to gene knockdown and co‐cultured with CAFs. (A) The S‐phase cell ratio of BT549 and MDA‐MB‐231 cells was measured by flow cytometric assay (n = 3). (B) Cell apoptosis of BT549 and MDA‐MB‐231 cells was determined using Annexin V‐FITC kit and flow cytometric. Early apoptotic cells are in the lower right quadrant; late‐stage apoptotic cells are in the upper right quadrant; viable cells are in the lower left quadrant (n = 3). (C) Cellular proliferation was assessed using the CCK8 assay (n = 3). (D) The invasion of BT549 and MDA‐MB‐231 cells was evaluated via transwell assay, with quantitative diagrams of invaded cells. Scale bar, 100 µm (magnification, ×100) (n = 3). (E) The viability of BT549 and MDA‐MB‐231 in the presence of EPI (1.2 µg/mL) was determined by the CCK8 kit (n = 3). Data represent mean ± SD. p‐values were calculated using a student t‐test. **p < .01, ***p < .001.
