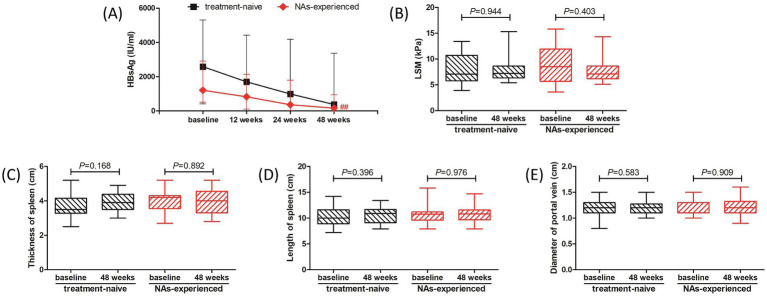
Figure 3.
Evolution of therapeutic response to pegylated interferon-α-2b over 48 weeks in treatment-naïve group and nucleos(t)ide analogs (NAs)-experienced group. (A) Changes of serum HBsAg level at different observational time points in two groups. The black line indicates treatment-naïve group, while the red line indicates NAs-experienced group. The points indicate median, while the bars indicate interquartile range. Statistical analyses were performed using Kriskal-Wallis H test followed by Dunn’s multiple comparison test. (B) Change of liver stiffness measurement (LSM) at 48 weeks compared with baseline in two groups. (C) Change of thickness of spleen at 48 weeks compared with baseline in two groups. (D) Change of length of spleen at 48 weeks compared with baseline in two groups. (E) Change of diameter of portal vein at 48 weeks compared with baseline in two groups. The central lines indicate median or mean, the boxes indicate standard deviation or interquartile range, and the bars indicate the minimum to maximum range. Statistical analyses were performed using Mann–Whitney U test or Student’s t test. ## p < 0.01 compared with baseline.

