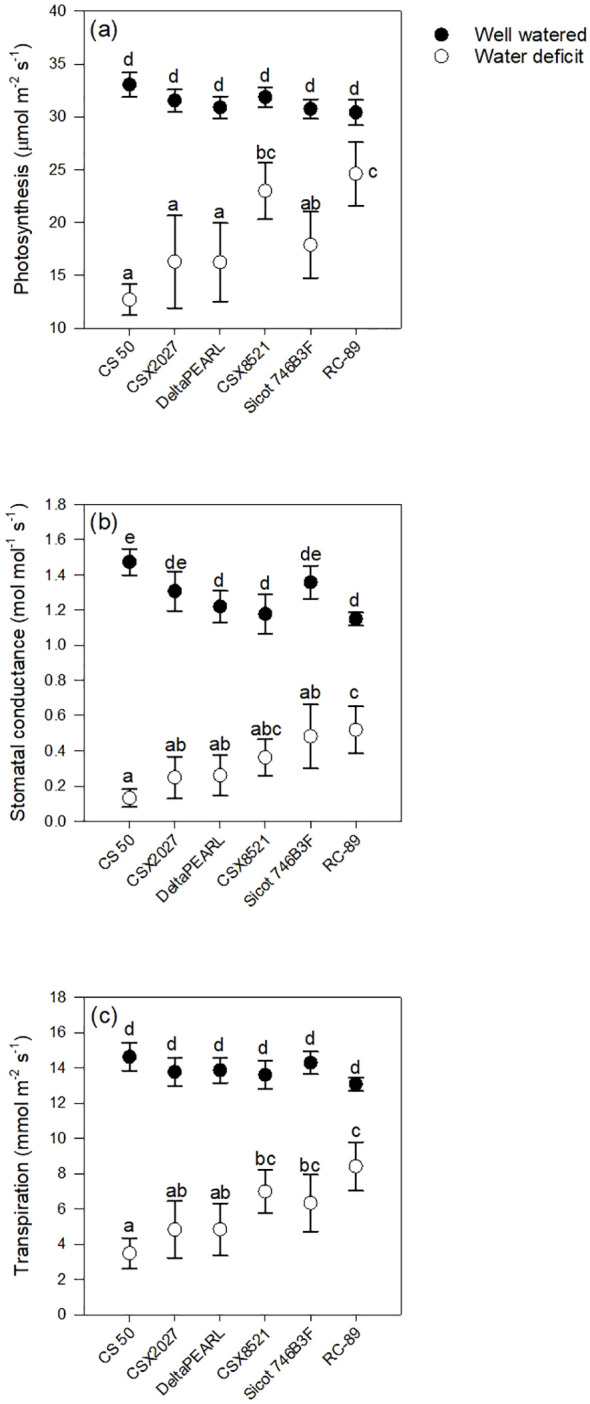
Figure 2.

Interactive effect of water treatment and genotype on (A) photosynthesis, (B) stomatal conductance, and (C) transpiration at the timepoint when water-deficit plants reached FTSW= 0.4 across Experiments 2 and 3. Values represent mean ±SE. Letters represent significant difference at P< 0.05 using Fisher’s LSD.
