

Summary
Gametes in many species develop in cysts, clusters of germ cells formed by incomplete cytokinesis which remain connected through intercellular bridges (ICBs). These connections enable sharing of cytoplasmic components between germ cells and, in the female germline, enrich select cells in the cyst to become the oocyte(s). In mice, germline cysts of variable sizes are generated during embryonic development, thought to result from cyst fractures. Studies of fixed samples failed to capture fracture events, thus the mechanism remained elusive. Here we use high-resolution live imaging of germ cells within their native tissue environment to visualize germline cyst dynamics. With this novel approach, we reveal a striking motile phenotype of gonad-resident germ cells and show that this randomly oriented cell-autonomous motile behavior during cyst formation underlies fracture events. Conversely, we show that stabilized ICBs help resist excessive fracturing. Additionally, we find that motility and thus fracture rates gradually decrease during development in a sex-dependent manner, completely ceasing by the end of cyst-forming divisions. These results lead to a model where the opposing activities of developmentally regulated cell motility and stable ICBs give rise to cysts of variable sizes. We corroborate these results by developing a model that uses experimentally measured fracture rates to simulate cyst formation and fracture, and show that it can reproduce experimentally measured cyst sizes in both male and female. Understanding how variable cysts form will enable further studies of mammalian oocyte selection and establishment of the ovarian reserve.
eTOC Blurb
Gametes emerge from evolutionarily conserved structures termed germline cysts which in mice are variable in size. Here Levy and Leite et al. show that cyst size variability is generated by cyst fractures, which are promoted by randomly oriented germ cell motility during cyst formation and resisted by stable connections between germ cells.
Introduction
Gametes have the unique potential to give rise to the next generation and thus ensure the continuity of a species. Acquiring such potential involves a highly specialized developmental program that includes cell biological processes not utilized by somatic lineages. Most strikingly, gametes in most animals emerge from germline cysts, clusters of cells connected by intercellular bridges (ICBs), which are products of arrested and stabilized cytokinetic furrows.1 Such physical connection between cells may serve several functions. For example, in the female germline of species that produce so-called meroistic cysts, including that of Drosophila melanogaster and mice, one or a few cells are selected to become oocytes within the cyst and the remaining sister cells, termed nurse cells, contribute cytoplasmic content to the future oocyte(s).2 This enrichment creates larger oocytes than could be generated by a single cell’s biosynthetic activity and improves individual oocyte competence to support embryonic development.3–5
Germline cysts come in a variety of sizes and structures across the animal kingdom, ranging from a simple two-cell cyst to ring structures or large asymmetrically branched topologies.6–8 How size and topology relate to function is best understood in the female germline of Drosophila. A single germ cell in the fly ovary will divide four times with incomplete cytokinesis, always resulting in a maximally branched 16-cell cyst (Figure 1A).9 The invariant division sequence and maximally branched cyst topology inform polarized material transport through ICBs, selecting a single cell to become the oocyte.10 In contrast to the stereotyped female fly cyst, cysts in a mammalian species such as the mouse display variable structure and size.11 The number of cells in a cyst determines the amount of cytoplasmic material an oocyte can procure for itself; thus, cyst size is likely a key functional aspect of the female germline program. Indeed, perturbing ICB stability, which altered cyst size, resulted in a reduced number of oocytes and subfertility in mice.12
Figure 1. Live imaging germline cyst formation in the mouse reveals germ cell motility and cyst fractures.

(A) Schematic of female germline cyst formation in Drosophila and mice. Drosophila cyst formation always produces the same pattern of 16-cells, whereas mouse cysts can vary in both size and structure.
(B) Overview of tamoxifen-inducible germ cell labeling strategy. Transgenic mouse lines were crossed to generate embryos with mTmG; Oct4-MerCreMer; H2B-miRFP720 alleles. Pregnant females were injected with tamoxifen at E9.5 or E10.5, embryos are dissected at E11.5-E14.5 and isolated gonad/mesonephros complexes are mounted for imaging with a spinning-disk confocal microscope.
(C) Tamoxifen dosage tunes germ cell labeling. A high tamoxifen dose at E9.5 (2.5mg/ 40g body weight) labels almost all germ cells (mG expressing cells) by E12.5, while a lower dose (0.25mg/ 40g body weight) labels cells more sparsely, allowing observation of individual cyst behaviors.
(D) Live imaging of an E12.5 ovary captures a two-cell cyst dividing and fracturing into sub-cysts of 1 and 3 cells. Green arrows indicate cells that are about to divide, and orange arrows show the fracture of an ICB. Labeled cyst was imaged every 5 minutes for 7.5 hours.
Related to Figure S1.
See also Video S1.
As with most mammals, mouse oocytes are generated only once in the lifetime of an animal, during fetal development, and are then set aside to sustain fertility throughout life. Primordial germ cells (PGCs), specified during early development, migrate into the newly formed gonads and undergo mitotic expansion between embryonic days (E)10.5 and E14.5. During this expansion, divisions with incomplete cytokinesis give rise to germline cysts, which in the female gonad are halted by the germ cells entering and subsequently arresting in meiosis.13–16 Clonal labeling of PGCs showed that each founding cell gave rise to 30±14 progeny in the ovary by the time of meiotic entry, indicating that on average each PGC divided five times.11,17 Surprisingly, however, clonally related progeny did not form one coherent cyst, but rather on average 5 physically separated cell clusters with no obvious connections in between them (Figure 1A). Therefore, this led to the conclusion that cysts must fracture into smaller sub-cysts, speculating that fractures might occur either as a division is completed through cytokinesis or as a consequence of somatic cells moving in between germ cells and forcing them apart.11 However, as these events were not captured in the analysis, which used fixed and immunostained samples of embryonic ovaries, the mechanism of fractures remained elusive.
Here we directly address these questions about mammalian germline cyst formation by using a novel combination of a germ cell membrane labeling strategy and high-resolution live imaging to directly visualize germline cyst dynamics for the first time. With this novel approach we show that motile germ cell behavior during cyst formation underlies fracture events. We find that germ cells display a surprising protrusion-driven motility phenotype for several days after their arrival in the embryonic gonad. We show that motility is randomly oriented in individual cells, even as they remain connected in cysts, and that this activity can fracture intercellular connections. On the other hand, we show that stabilized intercellular connections act to resist excessive fracturing. Our results reveal the mechanism of cyst fracture and suggest a tug-of-war model where the opposing activities of cell motility and intercellular bridge stability determine the rate of fractures and ultimately the size of cysts.
Results
Live imaging embryonic ovaries captures germline cyst dynamics
Germ cells undergoing cyst formation between E11.5-E14.5 populate the embryonic gonad, an organ densely packed with germ cells and somatic support cells. To visualize individual cysts within this dense tissue environment and to label germ cells of the same clonal origin in fixed samples, previous studies used a tamoxifen-inducible Cre-recombinase (CAG CreER) to induce sparse expression of YFP (R26 YFP) in PGCs just prior to their arrival in the embryonic gonad (E10.5).11,18 To assay the dynamic behavior of germ cell cysts in the gonad by live imaging, we adapted this labeling strategy by implementing two crucial improvements: 1) we use a germ cell specific tamoxifen-inducible Cre-recombinase line (Oct4-MerCreMer19) that allows us to label only germ cells, and 2) we use a membrane reporter line, mTmG20, which upon Cre expression switches membrane-Tomato (mT) to membrane-GFP (mG) expression and allows accurate visualization of cell shapes (Figure 1B and Figure S1A). We calibrated the dose of tamoxifen injected into pregnant females at E10.5 and found that 0.25mg tamoxifen/40g body weight yielded sparse expression of mG-expressing germ cells, allowing us to visualize individual cysts (Figure 1C). Well-established ex vivo culture techniques exist for the embryonic gonad, which allow for high-fidelity development for several days following the arrival of germ cells.21–23 Notably, ovaries cultured ex vivo for 17 days were demonstrated to develop follicles which produced oocytes that gave rise to viable offspring.24 Despite these advanced ex vivo culture methods, the embryonic gonad has only been subject to very limited investigation by live imaging, focusing only on timepoints before or after cyst formation using low-resolution imaging.25,26 To investigate the dynamics of cyst formation with high spatiotemporal resolution, we have established a modified air-liquid interphase culture amenable to live imaging on a Yokogawa CSU-W1 spinning disk confocal microscope (Figure 1B). This setup has allowed us to capture germ cell dynamics for 12–16 hours at a time, acquiring Z-stacks of several cysts every 5 or 10 minutes in two or three different channels. Our technique is minimally invasive, as we capture abundant germ cell proliferation and no signs of compromised tissue viability during imaging. Moreover, cyst size after live imaging (E12.5 gonads imaged for 12 hours) was similar to that of in vivo gonads isolated at the time corresponding to the end of imaging (E13.0), further indicating no adverse effects of live imaging on germ cell development (Figure S1B).
Germ cell motility drives cyst fractures
Harnessing the germ cell membrane labeling strategy and live imaging setup of embryonic gonads, we have visualized for the first time the dynamic behavior of germ cells as they divide with incomplete cytokinesis and form cysts. Imaging labeled cysts in E11.5 and E12.5 gonads revealed that germ cells are unexpectedly highly protrusive, even as they remain connected to each other in a cyst (Figure 1D) (Video S1). We noted that germ cells tend to have one main protrusion, often measuring the diameter of the cell in length, with smaller branches at the tip. This morphology resembled actin polymerization-driven pseudopodia observed in other cell types.27 PGCs are known to migrate extensively in the developing embryo from their site of specification into the forming gonad, a widely conserved phenomenon in many animal species.28 Migratory mouse PGCs have been shown to display actin-rich protrusions in fixed images29, however, protrusive activity after their arrival in the gonad has not been previously seen.
While PGC migration is a directed process, with protrusions consistently oriented along the migratory path, we observed that protrusions of gonad-resident germ cells frequently changed orientation (Figures 2A and 2B) (Video S2). To quantify protrusion orientation, we segmented and created 3D masks for individual germ cells in time lapse images, fit a vector from the centroid of each cell body to the end of its main protrusion (protrusion vector) and projected this vector onto a unit sphere (Figure 2C and 2D). We plotted the protrusion vectors from germ cells in the same ovary at a single timepoint on the same sphere, allowing us to compare the observed protrusion orientations to a random distribution of vectors (Figure 2D). We found that these were not significantly different, therefore, we conclude that protrusions randomly explore the surrounding 3D space. Importantly, our live imaging dataset also revealed cyst fracture events for the first time (Figure 1D). Interestingly, fracture of an ICB was accompanied by cells moving away from each other and in the process stretching the intercellular connection, which at a certain point tended to break (Figures 1D and 2E) (Video S1). This suggests, that in contrast to previous studies, which predicted that the decision of cyst fracture is mediated by the decision whether or not to complete cytokinesis (ref), fractures are rather mediated by cells moving away from each other. Indeed, none of the observed fractures (26 fractures in E11.5 gonads) occurred around the time of mitosis, when cells retract their protrusions and round up, but rather occurred when cells displayed protrusive activity. To examine whether fractures were limited to any particular phase of the cell cycle, we considered time lapse datasets in which both a division and a fracture occurred (n=4) (Figure 1D and Figure S2A). We found that two fractures occurred 4–5 hours before division, while the other two took place 2–4.5 hours after division (Figure S2B). Considering a ~16 hour cell cycle length30, these data indicate that fractures can occur at different stages in the cell cycle.
Figure 2. Randomly oriented germ cell motility can drive cells apart and is correlated with cyst fractures.
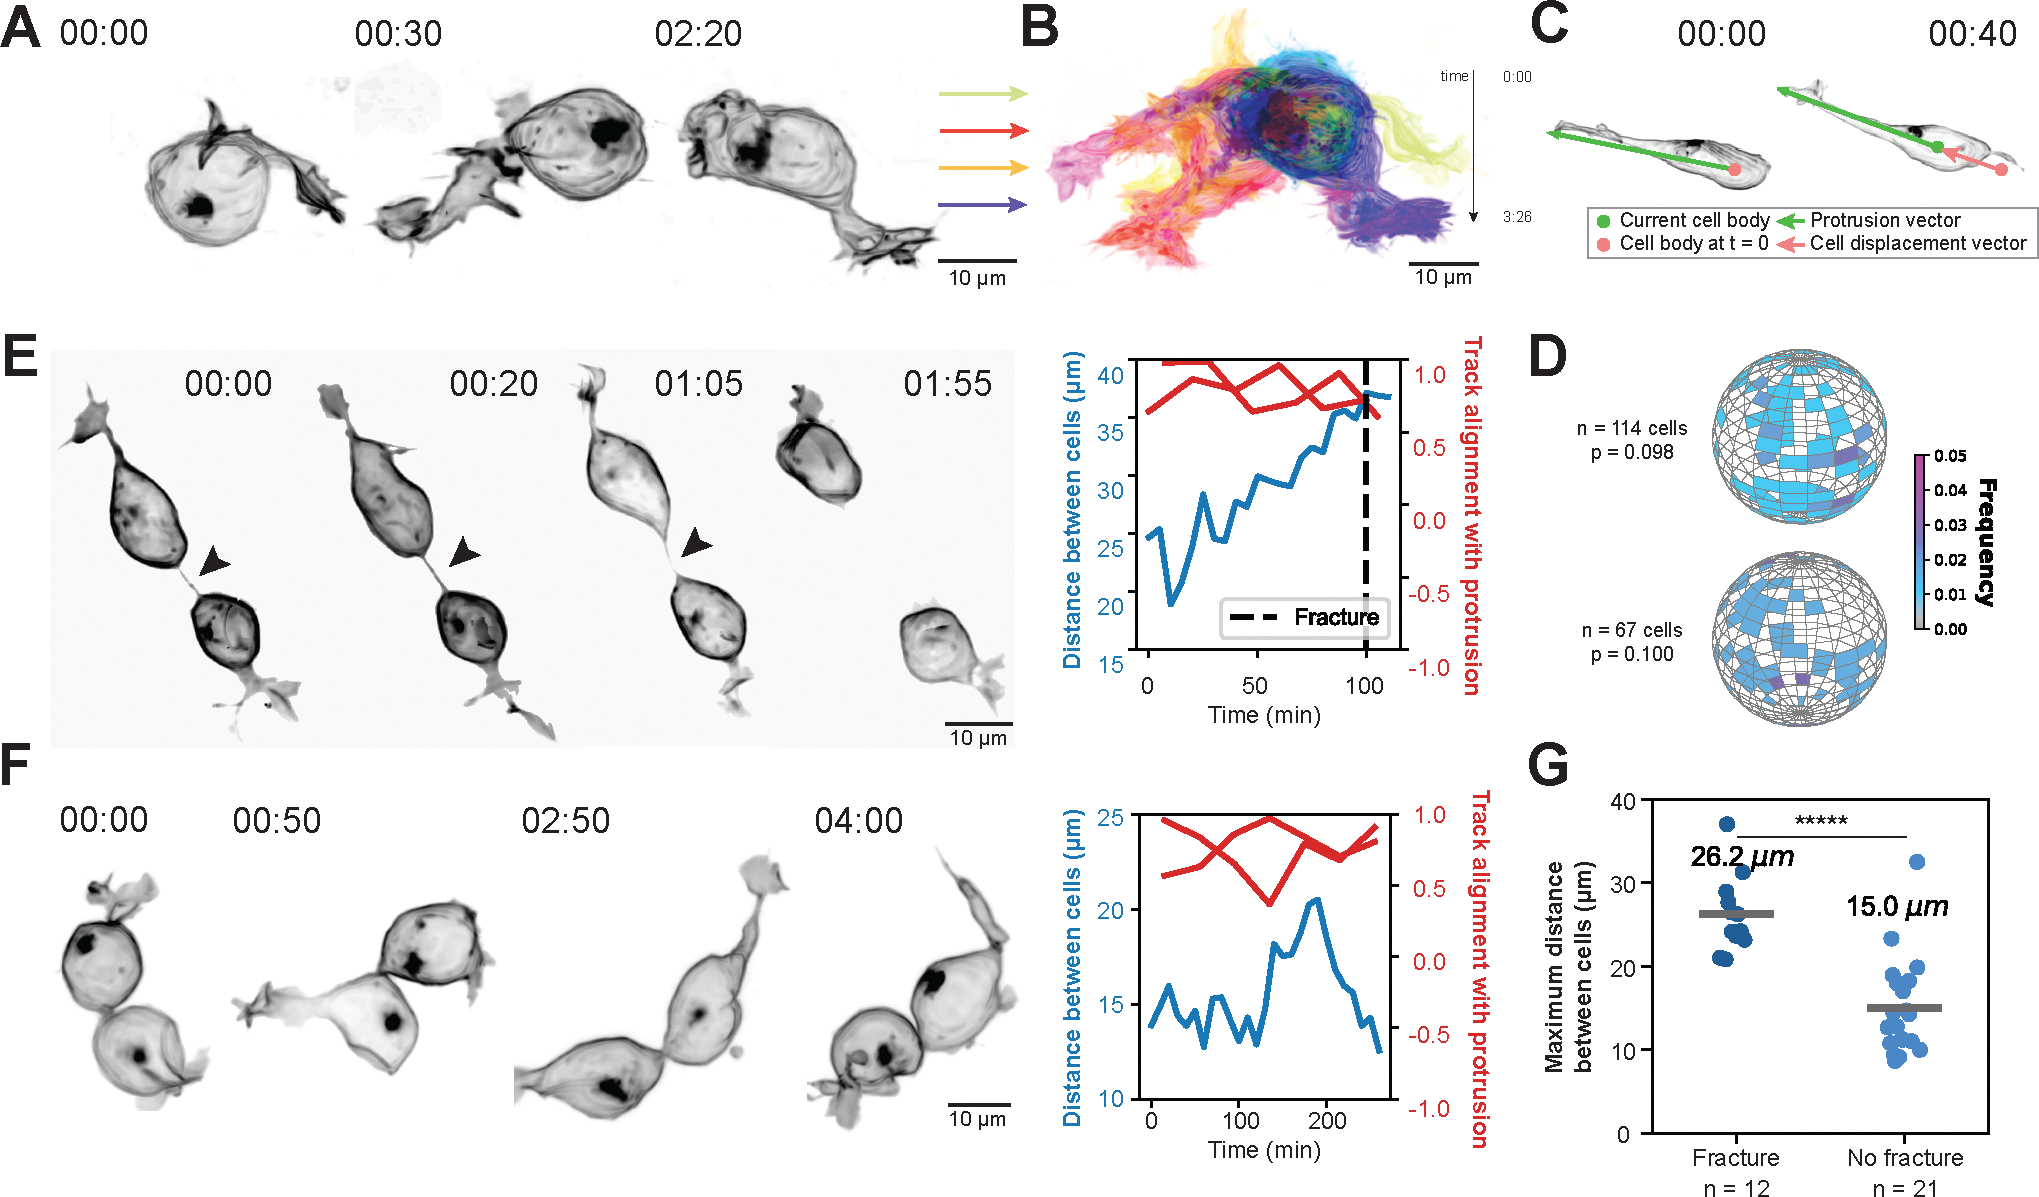
(A) Live imaging of a membraneGFP-labeled germ cell over time in an E11.5 gonad. Time shown in hrs:mins. Scale bar 10μm.
(B) Maximum intensity projection of all timepoints captured of germ cell in (a). Color coding indicates time, shown in hrs:mins. Scale bar 10μm.
(C) Illustration demonstrating quantification of membrane protrusion orientation overlaid on an example E11.5 germ cell. The green dot indicates the cell body centroid at the current timepoint, while the pink dot indicates the cell body centroid at the start of imaging. The protrusion vector (green) from the current cell body centroid to the tip of the protrusion marks the direction of the cell’s protrusion at each timepoint, while the cell displacement vector (pink) from the initial cell body centroid to the current cell body centroid tracks the direction of the cell’s movement at each timepoint. Time shown in hrs:mins.
(D) Histograms of membrane protrusion orientation measured in spherical coordinates for germ cells in two E11.5 ovaries. Color coding indicates the frequency of cells’ main protrusion vector orientation at a single timepoint. N indicates the number of cells analyzed in each ovary. Statistical analysis between observed distributions and random distribution of vectors was performed using 10,000 iterations of the two-dimensional Kolmogorov-Smirnov test.
(E) (left) Live imaging of cyst dynamics at E11.5 resulting in an ICB fracture. Arrowhead points to ICB. Time shown in hrs:mins. Scale bar 10μm. (right) Distance between the centroids of two cells in the cyst (blue) and alignment of membrane protrusion vectors and cell body displacement vectors for each cell (red) plotted over time. Time shown in mins. Dashed line indicates time of fracture.
(F) (left) Live imaging of cyst dynamics at E11.5 which does not result in an ICB fracture. Arrowhead points to ICB. Time shown in hrs:mins. Scale bar 10μm. (right) Distance between the centroids of two cells in the cyst (blue) and alignment of membrane protrusion vectors and cell body displacement vectors for each cell (red) plotted over time. Time shown in mins.
(G) Maximum distance between the centroids of two cells connected by an ICB in cysts that fractured versus did not fracture. Line and numeric value indicate the average distance reached between centroids in each case. N indicates the number of pairs of connected cells analyzed. Statistical analysis performed using unpaired two-tailed t-test (***** p < 0.00001).
Related to Figures S2 and S3.
See also Video S2.
Together, these data suggest that the main driver of ICB fractures is germ cell motility. To investigate this hypothesis further, we quantified and contrasted cellular behaviors which resulted in ICBs either fracturing or remaining intact (Figures 2E and 2F, and Figure S3A and S3B). First, we correlated each cell’s protrusion vector at each time point (t = n) with the vector of cell body displacement (Figure 2C) measured between t = n and t = n – 10 min and found a strong alignment between the two in both fracture and non-fracture scenarios, indicating that the direction of cell body movement is related to the orientation of the main cell protrusion (Figure 2E and 2F). Next, we plotted the distance between neighboring cell body centroids over time. These results revealed that ICBs could stretch to some degree without fracturing, however, when the distance of cell body centroids exceeded ~20 μm, a fracture was highly likely (Figures 2E and 2F, and Figure S3A and S3B). Based on this we propose that a non-directional, cell-autonomous motility program drives cyst fractures by forcing cells apart to a degree that is no longer accommodated by ICB stretching.
Inhibiting motility abrogates fractures
Our data thus far established a strong correlation between germ cell-autonomous motility and ICB fractures. To experimentally test the roles of protrusion-driven motility in promoting fractures we inhibited actin branching dynamics with an Arp2/3 inhibitor (CK-666) in cultured embryonic ovaries at E12.5 and live imaged labeled cysts (Figure 3A). To quantify protrusive activity, we calculated cell protrusion scores at the beginning of each time lapse. This was done by segmenting individual cells for the first 10 time points, projecting a defined number of rays from the centroid of each cell to the surface in 3D and calculating the coefficient of variation of ray lengths (Figure 3B). We found that germ cells lost protrusive activity and became rounded, signified by a decrease in their protrusion score, whereas DMSO alone did not significantly affect the protrusion score (Figure 3B and Figure S4A) (Video S3). This indicates that protrusions are driven by branching actin polymerization dynamics. We also quantified the rate of cyst fractures by dividing the number of fractures by the number of connection hours observed (e.g. 2 connection hours means we observed 2 ICBs for 1 hour). In contrast to controls, we did not detect any fractures in Arp2/3-inhibited cysts, conclusively demonstrating that protrusions indeed drive cyst fractures (Figure 3C). We additionally verified that ICBs remained unaffected due to Arp2/3 inhibition, by visualizing and quantifying two ICB markers (TEX14 and MgcRacGAP) in immunostained samples (Figure S4B-S4E).
Figure 3. Germ cell motility drives cyst fractures, while stable ICBs act to limit excessive fracturing.

(A) Example time sequences of membraneGFP-labeled germ cell dynamics in (top) wildtype, (second) Arp2/3 inhibitor treated, (third) Arp2/3 inhibitor treated TEX14 reduced, and (bottom) TEX14 reduced E12.5 ovaries. Time shown in hrs:mins. Scale bar 10μm.
(B) Quantification of protrusive germ cell morphology in wildtype, Arp2/3 inhibitor treated, TEX14 reduced plus Arp2/3 inhibitor treated, and TEX14 reduced germ cells in E12.5 ovaries. Each data point indicates the protrusion score calculated for each cell by averaging protrusion scores from the initial 10 time points of live imaging time lapse movies. Line and numeric value indicate the average protrusion score for each condition. N indicates the number of cells analyzed. (top) Schematic illustrating protrusion score calculation. A defined number of rays from the centroid of each cell is projected to the surface in 3D and the coefficient of variation of ray lengths is calculated. Statistical analysis performed between different conditions using unpaired two-tailed t-test (not significant not shown, *** p < 0.001).
(C) Cyst fracture rates shown as fractures per hour connected for wildtype, Arp2/3 inhibitor treated, TEX14 reduced plus Arp2/3 inhibitor treated, and TEX14 reduced germ cells in E12.5 ovaries. Error bars indicate ± 1 standard deviation. (top) Schematic illustrating that fractures per hour connected was calculated as fracture events observed per hours of intact ICBs observed. N indicates the number of connection hours observed. Statistical analysis performed between different conditions using unpaired two-tailed t-test (not significant not shown, ***** p < 0.00001).
Related to Figures S4 and S5.
See also Video S3.
To more stringently test the role of motility in driving cells apart, we asked whether protrusive activity is still needed to fracture connections when ICBs were destabilized. We destabilized ICBs by reducing TEX14, a key component of ICBs in mice.31,32 Since TEX14 is a germ cell-specific factor33, we could employ a constitutive knockout approach. We microinjected CRISPR editing reagents, including Cas9 mRNA and two single guide RNAs targeting the same exon deleted previously31 into both cells of two-cell stage embryos with Oct4-MerCreMer; mTmG alleles (Figure S5A). We transferred edited embryos into pseudopregnant females, induced sparse cyst labeling with tamoxifen injection as before, and directly isolated embryonic ovaries from edited embryos at E12.5 for imaging. Since CRISPR editing can result in the generation of mosaic knockout alleles, we analyzed the degree of Tex14 knockout by genotyping embryos from which gonads were isolated for imaging. This revealed either complete (n=4) or mosaic knockout (n=2) of the targeted sequence (Figure S5B). To further examine the degree of TEX14 protein reduction in mosaic knockouts, ovaries were fixed and immunostained after completion of live imaging, revealing significant reduction in TEX14 positive structures (Figure S5C). Furthermore, we quantified cyst sizes in Tex14 edited ovaries and found that the average cyst size was significantly smaller compared to control gonads, indicating that reduction of TEX14 decreases cyst size, as expected (Figure S5D).
We then live imaged E12.5 ovaries with reduced TEX14 while simultaneously inhibiting Arp2/3 (Figure 3A and Video S3). As expected, actin inhibition reduced the protrusion score of germ cells (Figure 3B). Interestingly, while we did detect three fractures under these conditions, the overall fracture rate was similar to that of the only Arp2/3-inhibited condition (Figure 3C). This indicates that motility is required for separating germ cells even when ICBs are destabilized. These data conclusively show that motility is the main driver of fractures and suggest a scenario where motility is counteracted by stabilized ICBs, which limit excessive fracturing.
Destabilizing ICBs promotes fractures
To analyze the role stable ICBs play in resisting fractures, we first examined the state of germ cell ICBs at stages during which live imaging was conducted (E11.5 and E12.5). ICBs have been reported to undergo maturation in the postnatal mouse testis and Drosophila germline, which refers to the remodeling of midbodies into stable ICBs34,35. We therefore monitored ICB maturity by immunofluorescent staining using previously described markers, such as TEX14 and MgcRacGAP (Figure S6A and S6B)34. We found that both TEX14 and MgcRacGAP were present at ICBs. MgcRacGAP showed signs of maturation between E11.5 and E12.5, remodeling from midbody-puncta to a ring structure (Figure S6A). Importantly, however, TEX14 was localized in a ring structure at both E11.5 and E12.5, a hallmark of stable ICBs (Figure S6B). We therefore conclude that fractures occur in the presence of stabilized ICBs, such that germ cell motility can sometimes overpower the connection. Whether further maturation of the ICB confers more resistance to motility-induced fracture will require further analysis, ideally using live reporters of ICB maturity.
To experimentally test the role of stable ICBs in resisting excessive fracturing, we destabilized ICBs by reducing TEX14 and live imaged mG-labeled cysts at E12.5 (Figure3A and Video S3). When we live imaged cysts with at least two cells, we observed an increased number of fracture events compared to wildtype, despite their protrusion scores remaining similar (Figures 3A–3C). We also noted that germ cells broke away from each other without much apparent resistance, whereas in control ovaries a tug-of-war ensued as the ICB was extensively stretched before finally giving way and fracturing (Figure3A and Video S3). In summary, these data show that stable ICBs are necessary to prevent excessive motility-driven cyst fractures.
Motility is developmentally regulated and correlates with the rate of cyst fracture
Next, we set out to investigate how long germ cell motility persists during development. To address this question, we live imaged labeled germ cell cysts in embryonic ovaries at each day between E11.5 and E14.5, by which point all germ cells have entered meiosis36 (Figure 4A, Figure S7 and Video S4). We found that protrusive activity was similarly high in E11.5 and E12.5 ovaries, then gradually downregulated, with cells losing their protrusions and becoming rounded by E14.5 (Figure 4B). We also quantified the rate of cyst fractures at each embryonic day and found that overall, fractures were rare events (Figure 4C). For example, we only observed 14 ICB fractures during 1022 connection hours in E11.5 ovaries. Interestingly, we found that the fracture rate was similar at E11.5 and E12.5 and then gradually decreased, with no fractures observed by E14.5. Moreover, we found that decreasing protrusion scores and fracture rates during development were highly correlated (R2 = 0.996, p = 0.0021), further supporting the notion that protrusion-based cell motility drives cyst fractures.
Figure 4. Protrusive germ cell behavior and cyst fracture rates are developmentally regulated.

(A) Example live image sequences of membraneGFP-labeled cysts in E11.5-E14.5 ovaries. Time shown in hrs:mins. Scale bar 10μm.
(B) Quantification of protrusive germ cell morphology at each embryonic stage indicated in female gonads. Each data point indicates the protrusion score calculated for each cell by averaging protrusion scores from the initial 10 time points of live imaging time lapse movies. Line and numeric value indicate the average protrusion score for each embryonic stage. N indicates number of cells analyzed. Statistical analysis performed between adjacent embryonic stages using unpaired two-tailed t-test (not significant not shown,** p < 0.01, *** p < 0.001).
(C) Plot showing cyst fracture rates as fractures per hour connected at each embryonic stage indicated in female gonads. Error bars indicate ± 1 standard deviation. (inset) Schematic illustrating that fractures per hour connected was calculated as fracture events observed per hours of intact ICBs observed. N indicates number of connection hours observed.
Related to Figures S6 and S7.
See also Video S4.
Fracture rates control cyst sizes in both sexes
Previous work using fixed analysis found that female cysts did not grow by increasing cell numbers strictly as powers of two, but rather showed substantial variability in their size throughout the time of mitotic expansion.11,17 Quantifying cyst cell numbers in our data also revealed comparable dynamics of cyst growth and variability in cyst sizes at each embryonic day (Figure 5A). To address whether the measured fracture rates could explain the observed cyst sizes, we developed a probabilistic model to analyze cyst sizes produced by a single founding cell (Figure 5B). For each trial, we evolved a single germ cell from E10.5 to E14.5, corresponding to approximately 5 cell cycles. Cell cycle lengths were assigned by drawing a random number from a Gaussian distribution with a mean of 16 hours, which is the estimated cell cycle length of germ cells between E10.5 and E13.5.30 After the cell cycle length of a cell had elapsed, it divided into two daughter cells connected by an ICB. At each timestep, ICBs were given a chance of breaking according to our experimentally observed fracture rate, with a broken bridge resulting in two sub-cysts that go on to evolve separately. With a fracture rate of zero, the model resulted in the expected scenario where each germ cell invariantly gave rise to one cyst with 32 cells (Figure 5C). When we applied the measured fracture rates at each stage from E11.5 to E14.5, the model yielded variable cyst sizes, with the average simulated cyst size being comparable to the average observed cyst size (Figure 5D shows an example of a realization of the simulation and Figure 5E shows cyst sizes generated by running 1000 simulations per embryonic stage). The model produced highly comparable results when divisions generated linear or branched connections, indicating that cyst structure does not substantially influence the cyst sizes generated (Figure S8A and S8B).
Figure 5. Cyst fracture rates can explain observed cyst sizes in the ovary.

(A) Germ cells per cyst at each embryonic stage indicated in female gonads. Line and numeric value indicate the average cyst size for each embryonic stage. N indicates number of cysts analyzed.
(B) Schematic illustrating a probabilistic model of germline cyst development. A cyst is represented as a graph, where each cell is a node and each ICB is an edge in the network. Cysts originate from a single founder cell and undergo 5 divisions that grow the cyst network, while ICBs created by divisions are subject to fracture at each timepoint. The main parameter of the model is the probability of fracture applied to ICBs.
(C) Example of development of a simulated germline cyst when the probability of fracture is 0.
(D) Example of development of a simulated germline cyst when the probability of fracture is the experimental female rate of fracture.
(E) Simulated germline cyst sizes at each embryonic stage in female gonads. Simulated distributions were obtained by evolving a probabilistic model of E10.5 founder germ cells and applying the experimentally derived fracture rate. Line and numeric value indicate the average cyst size for each embryonic stage. N indicates number of cysts analyzed at final timepoint of simulation. Statistical analysis performed using the Mann-Whitney rank sum test between experimental (A) and simulated (E) cyst sizes at each embryonic stage: not significant at E11.5, E12.5 and E13.5, *p-value = 0.017 at E14.5.
Related to Figure S8.
We also tested whether experimentally measured fracture rates in TEX14 reduced ovaries could predict cyst size in this condition (Figure S8C). We used the fracture rate measured at E12.5 (Figure 3C) and applied this rate to the model of cyst formation from E10.5 to E12.5. Strikingly, simulations reproduced measured cyst sizes very accurately. Therefore, according to this model fractures play a key role in generating variable cyst sizes depending on their rate.
To further test the prediction that fracture rates control cyst sizes, we turned to analyzing cysts in the male, which were previously shown to be larger than those in female by E14.5.11,17 Using the same germ cell labeling strategy as before, we live imaged testes at each embryonic day from E11.5 to E14.5 (Figure 6A and Video S4). First, we confirmed that in our data male cyst sizes were indeed larger than female. We found that already by E12.5 male cysts consisted on average of 5.8 cells, whereas female cysts had an average of 2.3 cells, and that male cysts continued to show a larger size at E13.5 and E14.5 (we note that at E14.5 male cysts were often too large to accurately live image and quantify, therefore this statement for E14.5 is only qualitative) (Figures 5A, 6A, and 6B). According to our model we expect fracture rates to be lower in male to create larger cysts. We therefore measured the fracture rate at each embryonic day and found that already at E11.5 male cysts fractured less frequently than female, as well as that the fracture rate decreased more rapidly in male, with a single fracture detected over 2000 connection hours by E13.5 (Figure 6C). Together these data indicate that fracture rates are regulated in a sex-specific manner, and that experimentally measured fracture rates can give rise to differences in female and male cyst sizes.
Figure 6. Larger cysts in male correlates with lower cyst fracture rates observed in testes.

(A) Example live image sequences of membraneGFP-labeled cysts in E11.5-E14.5 testes. Time shown in hrs:mins. Scale bar 10μm.
(B) Germ cells per cyst at each embryonic stage indicated in male gonads. Line and numeric value indicate the average cyst size for each embryonic stage. Cysts were too large to accurately quantify from live images at E14.5, therefore data is not available. N indicates number of cysts analyzed.
(C) Plot showing cyst fracture rates as fractures per hour connected at each embryonic stage indicated in male gonads. Error bars indicate ± 1 standard deviation.
(D) Model summarizing germ cell behavior from the time of arrival in the ovary (E10.5) to meiotic entry (E14.5). A single founding cell undergoes ~5 mitotic divisions during this time with incomplete cytokinesis, forming ICBs. Randomly oriented germ cell protrusive activity can drive cells apart from each other during the interphase of the cell cycle and can result in ICB fractures. ~4 fracture events happen during cyst formation within a germ cell clone originating from a single founding cell, giving rise to smaller sub-cysts with variable sizes.
See also Video S4.
Discussion
Our live imaging results reveal that cyst formation in mice is accompanied by dynamic protrusive activity of their constituent germ cells. These protrusions promote cyst fractures, while stable ICBs act to resist fractures (Figure 6D). Our work therefore provides mechanistic explanation to previous observations made from fixed images. Additionally, we show that protrusive activity is developmentally downregulated, ceasing by meiotic entry in female germ cells. We find that this activity determines the rate of fractures, which in turn yields cysts with variable sizes. In addition to these results our work poses several mechanistic questions for future studies. These questions are related to the origins and developmental dynamics of fracture-inducing activity, the roles of ICBs and the functional significance of cyst size variability.
PGCs in most animals perform extensive migration from their site of specification in the early embryo to the developing gonads.28,37 Here we find that in mice germ cells also display protrusion-driven motile behavior in the gonads for several days following their arrival. It is highly likely that the machinery used for migratory motility remains active in gonad-resident germ cells and is ‘repurposed’ to generate variability in cyst sizes. In mice several factors have been implicated in PGC migration. The Cxcr4/Cxcl12 receptor ligand pair was shown to not only play a role in attracting PGCs to the gonads but was also implicated in PGC motility.38,39 The Kit ligand/receptor pair was similarly shown to be required for PGC motility 40–42 and intriguingly, adding soluble kit ligand to cultured gonads at E11.5 promoted germ cell motility. Additionally, the receptor tyrosine kinase-like protein Ror2 and its ligand Wnt5a were shown to be required for polarized protrusive behavior of PGCs in response to Kit ligand stimulation.29 Adhesion molecules, such as cadherins can also influence migratory behavior. An optimal level of E-cadherin in PGCs was required for migration and upregulation of E-cadherin and N-cadherin was observed after germ cells arrived in gonads.43,44 Finally, the developing gonads undergo extensive structural changes, forming sex cords that consist of organized basement membranes and somatic support cells surrounding germ cells, which may pose an obstacle to germ cell motility.25,45 Further work is needed to determine if any of the above factors might play a role in the observed gradual loss of motile germ cell behavior after their arrival in the gonads and thus contribute to stabilizing the size of cysts.
In the Drosophila female germline cyst, nurse cells transfer their cytoplasmic content to the oocyte through ICBs, which can reach up to 10 μm in diameter.46 Although EM images of mouse ovaries have captured mitochondria within ICBs13,47, and cytoplasmic sharing (of a cytoplasmic fluorescent protein) does occur48, it remains unknown whether meaningful material transport occurs through ICBs. Based on the size of mouse ICBs during the mitotic expansion phase, which average just under 1 μm in diameter (Figure S6) 34,49, we speculate that large-scale organelle transfer is unlikely. Instead, we propose that stabilized ICBs at this stage act to resist excessive fracturing, until motility is downregulated and larger membrane gaps, reaching ~5 μm in diameter, appear at the site of ICBs.49 We therefore suggest that ICBs can confer structural stability to cysts and ensure sufficient germ cells remain connected until cytoplasmic transfer is initiated through membrane gaps at later stages of oogenesis.
Why gametes in mice, and likely other mammals, emerge from variable cysts is an intriguing question. In the female germline, cyst size will determine the available cytoplasm that can be donated to the oocyte. It will be very interesting to examine whether small cysts fail to provide sufficient volume to the oocyte or large cysts “waste” resources on only one oocyte, and thus whether an optimal cyst size exists for generating a developmentally competent female gamete. Moreover, it is interesting to speculate that the regulation of cyst size may be an opportunity for selection. Perhaps germ cells with too high or too low motility, or too weak or overly stable ICBs would generate suboptimal cyst sizes and thus oocytes emerging from such cysts will not be represented in the gamete pool. The significance of variable cysts in the male germ line at this stage is even more enigmatic, as even basic characterization of how cysts break down to form spermatogonia is currently lacking.50
In summary, using our high-resolution live imaging approach we reveal the mechanism underlying the generation of variable germline cyst sizes in mice. These insights and our approach to study germline dynamics will precipitate further mechanistic inquiry into cyst formation and gamete production in mammals.
Resource availability
Lead contact
Requests for further information or resources should be directed to and will be fulfilled by the lead contact, Eszter Posfai (eposfai@princeton.edu).
Materials availability
Unique materials used in this study are available from the lead contact.
Data and code availability
The probabilistic fracture model code can be accessed at https://zenodo.org/records/11263587. All data reported in this paper will be shared by the lead contact upon request, and any additional information required to reanalyze the reported data in this paper is available from the lead contact upon request.
STAR★Methods
Experimental model and study participant details
Mouse lines and germ cell labeling
The following mouse lines were used in this study: CD1-IGS (Charles River strain#: 022), mTmG (B6.129(Cg)-Gt(ROSA)26Sortm4(ACTB-tdTomato,-EGFP)Luo/J; a gift from Dr. Danelle Devenport, Princeton University)20, H2B-miRFP72051, and Oct4-MerCreMer (B6(SJL)-Pou5f1tm1.1(cre/Esr1*)Yseg/J; JAX strain#: 016829).19 Mice were housed in a facility with ambient temperature of 21°C, average ambient humidity of 48%, and a daily light cycle of 14h. All mouse work was performed in accordance with Princeton University IACUC oversight. The H2B-miRFP720 (knock-in fusion to TIGRE locus) mouse line was used to visualize cell nuclei. The mTmG mouse line was used to visualize cell membranes by means of a membrane-targeted tdTomato, expressed in all cells. To label germ cells specifically, the mTmG line was crossed with the Oct4-MerCreMer mouse line, which could be chemically induced with tamoxifen to excise membrane-tdTomato and instead express membrane-GFP specifically.
For experiments, 5–8 week old female mTmG mice with or without H2B-miRFP720 were naturally mated with Oct4-MerCreMer males, or vice versa. Plugs identified the following morning were considered E0.5. Female mice were injected intraperitoneally with tamoxifen (Millipore-Sigma, T5648) dissolved in KolliphorEL (Millipore-Sigma, C5135) at E9.5 or E10.5 to label primordial germ cells. Since the Oct4-driven MerCreMer fusion protein is inducible, the tamoxifen dose was tuned to label germ cells either sparsely (0.25mg / 40g body weight) or densely (2.5mg / 40g body weight). Sparse labeling was used to label individual PGCs and generate clonally labeled cysts in the embryonic gonad. Mice were then euthanized at different stages of pregnancy (E11.5, E12.5, E13.5, E14.5), and the embryos dissected to obtain embryonic gonads for culture and live imaging.
Method details
Ex vivo embryonic gonad culture and imaging
Mesonephros-attached embryonic gonads dissected at various stages were mounted on Millicell culture membranes26 [Millipore PICM0RG50], and cultured in DMEM/F12 (Gibco, 11039021) + 10% FBS (Bio-techne, S11550) at 37C in 5%CO2. Two to eight gonads containing labeled germ cells were adhered to the cell-culture membrane using Matrigel (Corning, 47743–722 (CS)) spots, which was then placed in a 35mm dish with a glass coverslip (Mattek, P35G-1.5–20-C) that created a thin microwell to allow for gas exchange. Gonads were then imaged using a Nikon CSU-W1 SoRA spinning disk microscope every 10 minutes for up to 16 hours. At each timepoint, 16–24 Z-stacks were acquired in 2 wavelengths (488nm, 690nm) at 2μm Z-resolution using the CFI Apochromat TIRF 60X/1.49 NA objective. Imaging data was saved as .nd2 files.
Determining the sex of embryonic gonads
At E12.5 and later stages the sex of gonads could be easily determined based on the different morphologies of ovaries and testes. At E11.5, as gonads are not yet distinguishable as male or female, embryonic tissue was harvested during gonad isolation and genotyped by a single PCR for the Y-linked gene Rbm31y and its X-linked gametolog Rbm31x.52 Briefly, amplifying either gene with the same primer pair produces two distinct bands (269 bp for Rbm31x, 353 bp for Rbm31y), enabling the distinction of female and male samples by the presence of one or two bands, respectively.
Pharmacological perturbation of cyst dynamics
To perturb cyst cell dynamics using small molecules, E12.5 gonads with labeled germ cells were first obtained as described above. To inhibit Arp2/3, the gonads were mounted in media containing 500μM CK-666 (Sigma-Aldrich, SML0006) in DMSO or just DMSO control and processed for immediate live imaging.
Generation and validation of Tex14 mosaic knock-out gonads
To generate embryonic gonads with mosaic knock-out of Tex14, we integrated our germ cell labeling approach with genome editing at the two-cell stage to perform a same-generation knock-out and imaging experiment. Females with mTmG alleles were crossed with Oct4-MerCreMer males. The resulting embryos were isolated at E1.5 (two-cell stage) and both cells were microinjected with Cas9 mRNA and 2 sgRNA guides which deleted exon 10 of Tex14, which is the same exon deleted in a previous Tex14 knock-out mouse model.31 The following sgRNAs were obtained from Synthego: sgRNA1 AGGCUUUGGGAAUGAAAAGG and sgRNA2 GCUGUAAUGAAGGUCCCCCA. Two-cell stage microinjection was performed as described previously.53 Microinjected embryos were then transferred into pseudopregnant CD1 females, which were injected with tamoxifen at E10.5 as described above. At E12.5 edited embryos were isolated and their gonads dissected and mounted for live imaging as described above. Embryonic tissue was kept aside for knockout validation by PCR. Following imaging, edited gonads were fixed for whole-mount staining to demonstrate the degree of TEX14 reduction, compared to unedited control gonads. Briefly, gonads were fixed in 4% PFA on ice for 1 hour, washed, blocked, and stained overnight using [1:200] α-Tex14 (rabbit polyclonal, Abcam, ab41733) and [1:100] α-Oct4 (mouse monoclonal, Santa Cruz, sc-5279) primary antibodies. After further washes, ovaries were stained with [1:500] Alexa Fluor 555 α-rabbit (Invitrogen, A-21428) and 647 α-mouse (Invitrogen, A-21235) secondary antibodies overnight, then washed, mounted, and images by confocal fluorescence microscopy.
Quantification and statistical analysis
Image analysis
Prior to quantification, raw imaging files were processed by cropping out individual cysts and denoising using the Denoise.ai function of the Nikon NIS-Elements Analysis software.
Instance segmentation pipeline
A semi-automated method was used to perform instance segmentation of individual cells within cysts. Fiji was first used to create a mask for the whole cyst by global thresholding, separating the cyst as the foreground. Cellpose54 instance segmentation was applied to the original image, and only detected cells that lay within the whole cyst’s mask were kept. The Scipy 3D distance transform function was then applied to the whole cyst mask to detect local maxima in the distance from foreground to background. The Scikit-image watershed algorithm was used on the distance transformed image with the remaining Cellpose cells as initial markers, including the region only within the whole cyst’s mask. Individual cell masks were checked and sometimes manually corrected with the Napari GUI. This pipeline yields a mask for each individual cell within a cyst.
Quantifying cell protrusions
The instance segmentation masks were used to assign scores to cells to quantify their level of protrusion. Masks were converted to 3D meshes using the Marching Cubes module of Scikit-image. The center of the cell body was found by calculating the 3D distance transform of the mesh and assigning the global maximum point as the centroid. For each vertex on the mesh, the Euclidean distance to the centroid was calculated. The protrusion score was calculated as the coefficient of variation of these distances, or the variance of distances normalized by the mean distance. When calculating protrusion scores, stretched intercellular bridges were manually removed from the masks.
Protrusion orientation analysis
To quantify the orientation of membrane protrusions, 3D meshes of individual cells were used to identify a vector for each cell’s protrusion. Protrusion vectors were defined as connecting the cell body centroid and the farthest point on the surface of the mesh. The orientation of a protrusion vector was then recorded in spherical coordinates, with the normal vector of the z-stack defined as the top of the sphere.
Classification of mitosis and interphase
Cells were classified as mitotic based on the morphology of the cell membrane during the rounding up of prophase, as well as the chromatin condensation and de-condensation evident in the nuclear channel.
Quantification of ring canal protein intensity and diameter
To quantify ring canal protein intensity, TEX14 and MgcRacGAP puncta were detected as 1μm diameter spots using the Spot Detection module in the Nikon NIS-Elements Analysis software. The intensity of each spot was calculated as the mean intensity of pixels within the spot. The background intensity for each sample was calculated as the mean intensity of pixels in the image excluding the segmented spots. The background value was subtracted from each spot, and this difference was reported.
To quantify ring canal protein diameter, a linear profile was drawn over the long axis of each segmented spot, and the intensity along this profile was extracted in the Nikon NIS-Elements Analysis software. For midbody puncta, the full width at half maximum of the linear intensity profile was calculated and reported as the diameter. For mature ring canals, the distance between the highest point of intensity on each side of the ring was measured and reported as the diameter.
Statistical analysis
Data are shown as mean ± standard deviation. One-way ANOVA and post-hoc Bonferroni corrected t tests were used to determine statistically significant differences between groups with a level of p<0.05. Pearson’s correlation coefficient was used to evaluate correlations with a level of p<0.05. The Mann-Whitney rank sum test was used to determine statistically significant differences between non-normally distributed groups with a level of p<0.05. The two-dimensional Kolmogorov-Smirnov test was used to determine statistically significant differences between two-dimensional groups; because the analytic distribution is not known for the two-dimensional case, we ran the computational approximation of the test 10,000 times to compute the average p-value.
Modeling the distribution of cyst sizes based on fracture rate
The probabilistic fracture model (https://zenodo.org/records/11263587) was implemented in MATLAB using undirected graphs, with each cell as a node and each intercellular bridge as an edge. The aim of this model is to test whether the experimental rates of cyst fragmentation can explain the experimental distribution of cyst sizes at each developmental stage.
The input to the simulation was a single cell at the beginning of stage E10.5. The simulation evolved for up to 96 timesteps until stage E14.5, with each timestep representing 1 hour. At each timestep, a random number between 0 and 1 was drawn for each intercellular bridge. We calculated the fracture rate at each stage by dividing the number of fractures observed by the number of hours connected captured in the experimental data (see Figure 3). This fracture rate applied as the threshold that determined whether a bridge would fracture, with the bridge being removed if the random number was less than the threshold value. In addition to fractures, cell division was implemented. Cell cycle lengths were assigned by drawing a random number from a Gaussian distribution with a mean of 16 hours and a standard deviation of 1 hour. After the determined cell cycle length of a cell elapsed, it would give rise to two sister cells while preserving the mother’s existing bridges.
Cyst size refers to the number of cells connected in each network. At the end of each trial, cyst sizes were counted, resulting in 1 trial per clone. For each stage, 1000 trials were performed.
Supplementary Material
Video S1. Germline cyst cells are motile, driving fractures. Related to Figure 1.
A membraneGFP-labeled cyst in E12.5 ovary dividing from two to four cells, followed by an ICB fracture that gives rise to a three-cell and a one-cell cyst. H2B is shown in purple and labels nuclei.
Video S2. Germ cell protrusions in the gonad are randomly oriented. Related to Figure 2.
A membraneGFP-labeled E11.5 germ cell displays protrusions in seemingly random orientations, then divides.
Video S3. Inhibiting protrusions prevents fractures, while reducing ICBs increases them. Related to Figure 3. Movies of membraneGFP-labeled E12.5 female germline cysts in wildtype, CK-666 treated, TEX14 reduced + CK-666 treated, and TEX14 reduced ovaries.
Video S4. Protrusions decrease over developmental time in both sexes. Related to Figures 4 and 6. Movies of membraneGFP-labeled female (F) and male (M) germline cysts taken each day from E11.5-E14.5.
Key resources table.
| REAGENT or RESOURCE | SOURCE | IDENTIFIER |
|---|---|---|
| Antibodies | ||
| Rabbit polyclonal anti-TEX14, 1:200 | Abcam | Cat# ab41733 |
| Rabbit polyclonal anti-DDX4, 1:400 | Abcam | Cat# ab13840 |
| Mouse monoclonal AF 647 anti-SYCP3, 1:100 | Abcam | Cat# ab205847 |
| Mouse monoclonal AF 647 anti-MgcRacGAP, 1:100 | Santa Cruz Biotechnology | Cat# sc-271110 |
| Chicken polyclonal anti-GFP, 1:400 | Abcam | Cat# ab13970 |
| Donkey AF 488 anti-rabbit, 1:500 | Invitrogen | Cat# A21206 |
| Donkey AF 488 anti-chicken, 1:500 | Abcam | Cat# ab13970 |
| Donkey AF 647 anti-rabbit, 1:500 | Invitrogen | Cat# A31573 |
| Hoechst 3342 solution, 20 mM, 1:10,000 | Thermo Fisher | Cat # 62249 |
| Chemicals, peptides, and recombinant proteins | ||
| Tamoxifen | Sigma | Cat# T5648 |
| Kolliphor EL | Sigma | Cat# C5135 |
| Matrigel Basement Membrane Matrix | VWR | Cat# 47743-722 |
| DMEM/F-12 HEPES, no phenol red | Fisher/Gibco | Cat# 11039021 |
| Fetal bovine serum | Bio-techne | Cat# S11550 |
| CK-666 | Millipore-Sigma | Cat# SML0006-5MG |
| DMSO | Sigma | Cat# D2650-5X5ML |
| Experimental models: Organisms/strains | ||
| Mouse: mTmG: (B6.129(Cg)-Gt(ROSA)26Sortm4(ACTB-tdTomato,-EGFP)Luo/J | Gift from Dr. Danelle Devenport | RRID:IMSR_JAX:007676 |
| Mouse: Oct4Cre-MerCreMer: B6(SJL)-Pou5f1tm1.1(cre/Esr1*)Yseg/J | The Jackson Laboratory | RRID:IMSR_JAX:016829 |
| Mouse: H2B-miRFP740 | Nunley et al51 | N/A |
| Mouse: CD-1 IGS | Charles River Laboratory | Strain #022 |
| Oligonucleotides | ||
| Primer: Tex14 knockout forward: GGCTAACTGGTGTGAGTGGA | This paper | N/A |
| Primer: Tex14 knockout reverse: TTCCTGACTCCAAGCCTAGC | This paper | N/A |
| Primer: Rbm31 forward: CACCTTAAGAACAAGCCAATACA | Tunster et al52 | N/A |
| Primer: Rbm31 reverse: GGCTTGTCCTGAAAACATTTGG | Tunster et al52 | N/A |
| Recombinant DNA | ||
| sgRNA: Tex14 knockout: AGGCUUUGGGAAUGAAAAGG | This paper | N/A |
| sgRNA: Tex14 knockout: GCUGUAAUGAAGGUCCCCCA | This paper | N/A |
| Software and algorithms | ||
| FIJI | https://imagej.net/software/fiji/downloads | RRID:SCR_002285 |
| Napari | https://zenodo.org/records/13863809 | RRID:SCR_022765 |
| Cellpose 2.0 | Stringer et al.54 | RRID:SCR_021716 |
| Scikit-image | https://github.com/scikit-image/scikit-image | RRID:SCR_021142 |
| NIS Elements Analysis | Nikon | RRID:SCR_014329 |
| SnapGene | Dotmatics | RRID:SCR_015052 |
| MATLAB 2022a | MathWorks | RRID:SCR_001622 |
| Excel 2019 | Microsoft | RRID:SCR_016137 |
| Probabilistic fracture model | This paper | https://zenodo.org/records/11263587 |
Highlights.
Live imaging of germline cyst formation and fracture in the embryonic gonad
Germ cells display randomly oriented protrusions and cell motility for several days
Motility promotes cyst fractures, while stable intercellular bridges resist them
Fracture rate explains cyst size variability observed in both female and male gonads
Acknowledgements
We thank Andrea Jurisicova and Danelle Devenport for helpful discussions during the project, and Sha Wang and Gary Laevsky from the Princeton Molecular Biology Confocal Imaging Core for their assistance with imaging. Research reported in this publication was supported by Princeton University (E. Posfai), NIGMS of the National Institutes of Health under grant number T32GM007388 (E. Levy) and NHGRI of the National Institutes of Health under grant number T32HG003284 (I. Leite). The content is solely the responsibility of the authors and does not necessarily represent the official views of the National Institutes of Health.
Footnotes
Declaration of interests
The authors declare no competing interests.
Publisher's Disclaimer: This is a PDF file of an unedited manuscript that has been accepted for publication. As a service to our customers we are providing this early version of the manuscript. The manuscript will undergo copyediting, typesetting, and review of the resulting proof before it is published in its final form. Please note that during the production process errors may be discovered which could affect the content, and all legal disclaimers that apply to the journal pertain.
References
- 1.Brubacher JL (2024). Female Germline Cysts in Animals: Evolution and Function. In Syncytia: Origin, Structure, and Functions, Kloc M and Uosef A, eds. (Springer International Publishing; ), pp. 23–46. 10.1007/978-3-031-37936-9_2. [DOI] [PubMed] [Google Scholar]
- 2.Spradling AC, Niu W, Yin Q, Pathak M, and Maurya B (2022). Conservation of oocyte development in germline cysts from Drosophila to mouse. eLife 11, e83230. 10.7554/eLife.83230. [DOI] [PMC free article] [PubMed] [Google Scholar]
- 3.Pepling ME, Cuevas M. de, and Spradling AC (1999). Germline cysts: a conserved phase of germ cell development? Trends in Cell Biology 9, 257–262. 10.1016/S0962-8924(99)01594-9. [DOI] [PubMed] [Google Scholar]
- 4.Lu K, Jensen L, Lei L, and Yamashita YM (2017). Stay Connected: A Germ Cell Strategy. Trends in Genetics 33, 971–978. 10.1016/j.tig.2017.09.001. [DOI] [PMC free article] [PubMed] [Google Scholar]
- 5.Doherty CA, Amargant F, Shvartsman SY, Duncan FE, and Gavis ER (2022). Bidirectional communication in oogenesis: a dynamic conversation in mice and Drosophila. Trends in Cell Biology 32, 311–323. 10.1016/j.tcb.2021.11.005. [DOI] [PMC free article] [PubMed] [Google Scholar]
- 6.Diegmiller R, Nunley H, Shvartsman SY, and Imran Alsous J (2022). Quantitative models for building and growing fated small cell networks. Interface Focus 12, 20210082. 10.1098/rsfs.2021.0082. [DOI] [PMC free article] [PubMed] [Google Scholar]
- 7.Kumar V, and Elkouby YM (2023). Tools to analyze the organization and formation of the germline cyst in zebrafish oogenesis. Development 150, dev201349. 10.1242/dev.201349. [DOI] [PMC free article] [PubMed] [Google Scholar]
- 8.Smart M, Shvartsman SY, and Nunley H (2023). A model of replicating coupled oscillators generates naturally occurring cell networks. Development 150, dev202187. 10.1242/dev.202187. [DOI] [PMC free article] [PubMed] [Google Scholar]
- 9.De Cuevas M, Lilly M, and Spradling A (1997). GERMLINE CYST FORMATION IN DROSOPHILA. Annu. Rev. Genet. 31, 405–428. 10.1146/annurev.genet.31.1.405. [DOI] [PubMed] [Google Scholar]
- 10.Barr J, Diegmiller R, Colonnetta MM, Ke W, Imran Alsous J, Stern T, Shvartsman SY, and Schedl P (2024). To be or not to be: orb, the fusome and oocyte specification in Drosophila. Genetics, iyae020. 10.1093/genetics/iyae020. [DOI] [PMC free article] [PubMed] [Google Scholar]
- 11.Lei L, and Spradling AC (2013). Mouse primordial germ cells produce cysts that partially fragment prior to meiosis. Development 140, 2075–2081. 10.1242/dev.093864. [DOI] [PMC free article] [PubMed] [Google Scholar]
- 12.Ikami K, Nuzhat N, Abbott H, Pandoy R, Haky L, Spradling AC, Tanner H, and Lei L (2021). Altered germline cyst formation and oogenesis in Tex14 mutant mice. Biology Open 10. 10.1242/bio.058807. [DOI] [PMC free article] [PubMed] [Google Scholar]
- 13.Pepling ME, and Spradling AC (1998). Female mouse germ cells form synchronously dividing cysts. Development 125, 3323–3328. 10.1242/dev.125.17.3323. [DOI] [PubMed] [Google Scholar]
- 14.Gondos B (1973). Intercellular Bridges and Mammalian Germ Cell Differentiation. Differentiation 1, 177–182. 10.1111/j.1432-0436.1973.tb00112.x. [DOI] [Google Scholar]
- 15.Bowles J, Knight D, Smith C, Wilhelm D, Richman J, Mamiya S, Yashiro K, Chawengsaksophak K, Wilson MJ, Rossant J, et al. (2006). Retinoid Signaling Determines Germ Cell Fate in Mice. Science 312, 596–600. 10.1126/science.1125691. [DOI] [PubMed] [Google Scholar]
- 16.Koubova J, Menke DB, Zhou Q, Capel B, Griswold MD, and Page DC (2006). Retinoic acid regulates sex-specific timing of meiotic initiation in mice. Proceedings of the National Academy of Sciences 103, 2474–2479. 10.1073/pnas.0510813103. [DOI] [PMC free article] [PubMed] [Google Scholar]
- 17.Ikami K, Shoffner-Beck S, Tyczynska Weh M, Schnell S, Yoshida S, Diaz Miranda EA, Ko S, and Lei L (2023). Branched germline cysts and female-specific cyst fragmentation facilitate oocyte determination in mice. Proceedings of the National Academy of Sciences 120, e2219683120. 10.1073/pnas.2219683120. [DOI] [PMC free article] [PubMed] [Google Scholar]
- 18.Lei L, and Spradling AC (2017). Single-Cell Lineage Analysis of Oogenesis in Mice. In Germline Stem Cells Methods in Molecular Biology., Buszczak M, ed. (Springer; ), pp. 125–138. 10.1007/978-1-4939-4017-2_10. [DOI] [PubMed] [Google Scholar]
- 19.Greder LV, Gupta S, Li S, Abedin MJ, Sajini A, Segal Y, Slack JMW, and Dutton JR (2012). Analysis of endogenous Oct4 activation during induced pluripotent stem cell reprogramming using an inducible Oct4 lineage label. Stem Cells 30, 2596–2601. 10.1002/stem.1216. [DOI] [PMC free article] [PubMed] [Google Scholar]
- 20.Muzumdar MD, Tasic B, Miyamichi K, Li L, and Luo L (2007). A global double-fluorescent Cre reporter mouse. Genesis 45, 593–605. 10.1002/dvg.20335. [DOI] [PubMed] [Google Scholar]
- 21.Blandau RJ, Warrick E, and Rumery RE (1965). In Vitro Cultivation of Fetal Mouse Ovaries. Fertility and Sterility 16, 705–715. 10.1016/S0015-0282(16)35761-2. [DOI] [PubMed] [Google Scholar]
- 22.Motohashi HH, Sankai T, Nariai K, Sato K, and Kada H (2009). Effects of in vitro culture of mouse fetal gonads on subsequent ovarian development in vivo and oocyte maturation in vitro. Hum Cell 22, 43–48. 10.1111/j.17490774.2009.00067.x. [DOI] [PubMed] [Google Scholar]
- 23.Ming Z, Bagheri-Fam S, Frost ER, Ryan JM, Binder MD, and Harley VR (2024). Roles of TYRO3 Family Receptors in Germ Cell Development During Mouse Testis Formation. Preprint at bioRxiv, https://doi.org/10.1101/2024.03.05.583252 https://doi.org/10.1101/2024.03.05.583252. [Google Scholar]
- 24.Morohaku K, Tanimoto R, Sasaki K, Kawahara-Miki R, Kono T, Hayashi K, Hirao Y, and Obata Y (2016). Complete in vitro generation of fertile oocytes from mouse primordial germ cells. PNAS 113, 9021–9026. 10.1073/pnas.1603817113. [DOI] [PMC free article] [PubMed] [Google Scholar]
- 25.Molyneaux KA, Stallock J, Schaible K, and Wylie C (2001). Time-lapse analysis of living mouse germ cell migration. Dev Biol 240, 488–498. 10.1006/dbio.2001.0436. [DOI] [PubMed] [Google Scholar]
- 26.Lin R-S, Jimenez-Movilla M, and Dean J (2014). Figla-Cre Transgenic Mice Expressing Myristoylated EGFP in Germ Cells Provide a Model for Investigating Perinatal Oocyte Dynamics. PLOS ONE 9, e84477. 10.1371/journal.pone.0084477. [DOI] [PMC free article] [PubMed] [Google Scholar]
- 27.Fritz-Laylin LK, Riel-Mehan M, Chen B-C, Lord SJ, Goddard TD, Ferrin TE, Nicholson-Dykstra SM, Higgs H, Johnson GT, Betzig E, et al. (2017). Actin-based protrusions of migrating neutrophils are intrinsically lamellar and facilitate direction changes. eLife 6, e26990. 10.7554/eLife.26990. [DOI] [PMC free article] [PubMed] [Google Scholar]
- 28.Barton LJ, LeBlanc MG, and Lehmann R (2016). Finding their way: themes in germ cell migration. Current Opinion in Cell Biology 42, 128–137. 10.1016/j.ceb.2016.07.007. [DOI] [PMC free article] [PubMed] [Google Scholar]
- 29.Laird DJ, Altshuler-Keylin S, Kissner MD, Zhou X, and Anderson KV (2011). Ror2 enhances polarity and directional migration of primordial germ cells. PLoS Genet 7, e1002428. 10.1371/journal.pgen.1002428. [DOI] [PMC free article] [PubMed] [Google Scholar]
- 30.Tam PPL, and Snow MHL (1981). Proliferation and migration of primordial germ cells during compensatory growth in mouse embryos. Development 64, 133–147. 10.1242/dev.64.1.133. [DOI] [PubMed] [Google Scholar]
- 31.Greenbaum MP, Yan W, Wu M-H, Lin Y-N, Agno JE, Sharma M, Braun RE, Rajkovic A, and Matzuk MM (2006). TEX14 is essential for intercellular bridges and fertility in male mice. Proceedings of the National Academy of Sciences 103, 4982–4987. 10.1073/pnas.0505123103. [DOI] [PMC free article] [PubMed] [Google Scholar]
- 32.Greenbaum MP, Iwamori N, Agno JE, and Matzuk MM (2009). Mouse TEX14 Is Required for Embryonic Germ Cell Intercellular Bridges but Not Female Fertility1. Biology of Reproduction 80, 449–457. 10.1095/biolreprod.108.070649. [DOI] [PMC free article] [PubMed] [Google Scholar]
- 33.Rajkovic A, Yan M S C, Klysik M, and Matzuk M (2001). Discovery of germ cell-specific transcripts by expressed sequence tag database analysis. Fertil Steril 76, 550–554. 10.1016/s0015-0282(01)01966-5. [DOI] [PubMed] [Google Scholar]
- 34.Greenbaum MP, Ma L, and Matzuk MM (2007). Conversion of midbodies into germ cell intercellular bridges. Developmental Biology 305, 389–396. 10.1016/j.ydbio.2007.02.025. [DOI] [PMC free article] [PubMed] [Google Scholar]
- 35.Price KL, Tharakan DM, and Cooley L (2023). Evolutionarily conserved midbody remodeling precedes ring canal formation during gametogenesis. Developmental Cell 58, 474–488.e5. 10.1016/j.devcel.2023.02.008. [DOI] [PMC free article] [PubMed] [Google Scholar]
- 36.Feng C-W, Bowles J, and Koopman P (2014). Control of mammalian germ cell entry into meiosis. Molecular and Cellular Endocrinology 382, 488–497. 10.1016/j.mce.2013.09.026. [DOI] [PubMed] [Google Scholar]
- 37.Molyneaux K, and Wylie C (2004). Primordial germ cell migration. The International Journal of Developmental Biology 48, 537–543. 10.1387/ijdb.041833km. [DOI] [PubMed] [Google Scholar]
- 38.Molyneaux KA, Zinszner H, Kunwar PS, Schaible K, Stebler J, Sunshine MJ, O’Brien W, Raz E, Littman D, Wylie C, et al. (2003). The chemokine SDF1/CXCL12 and its receptor CXCR4 regulate mouse germ cell migration and survival. Development 130, 4279–4286. 10.1242/dev.00640. [DOI] [PubMed] [Google Scholar]
- 39.Ara T, Nakamura Y, Egawa T, Sugiyama T, Abe K, Kishimoto T, Matsui Y, and Nagasawa T (2003). Impaired colonization of the gonads by primordial germ cells in mice lacking a chemokine, stromal cell-derived factor-1 (SDF-1). Proceedings of the National Academy of Sciences 100, 5319–5323. 10.1073/pnas.0730719100. [DOI] [PMC free article] [PubMed] [Google Scholar]
- 40.Runyan C, Schaible K, Molyneaux K, Wang Z, Levin L, and Wylie C (2006). Steel factor controls midline cell death of primordial germ cells and is essential for their normal proliferation and migration. Development 133, 4861–4869. 10.1242/dev.02688. [DOI] [PubMed] [Google Scholar]
- 41.Gu Y, Runyan C, Shoemaker A, Surani A, and Wylie C (2009). Steel factor controls primordial germ cell survival and motility from the time of their specification in the allantois, and provides a continuous niche throughout their migration. Development 136, 1295–1303. 10.1242/dev.030619. [DOI] [PubMed] [Google Scholar]
- 42.Gu Y, Runyan C, Shoemaker A, Surani MA, and Wylie C (2011). Membrane-Bound Steel Factor Maintains a High Local Concentration for Mouse Primordial Germ Cell Motility, and Defines the Region of Their Migration. PLOS ONE 6, e25984. 10.1371/journal.pone.0025984. [DOI] [PMC free article] [PubMed] [Google Scholar]
- 43.Bendel-Stenzel MR, Gomperts M, Anderson R, Heasman J, and Wylie C (2000). The role of cadherins during primordial germ cell migration and early gonad formation in the mouse. Mechanisms of Development 91, 143–152. 10.1016/S0925-4773(99)00287-7. [DOI] [PubMed] [Google Scholar]
- 44.Piprek RP, Kloc M, Mizia P, and Kubiak JZ (2020). The Central Role of Cadherins in Gonad Development, Reproduction, and Fertility. International Journal of Molecular Sciences 21, 8264. 10.3390/ijms21218264. [DOI] [PMC free article] [PubMed] [Google Scholar]
- 45.DeFalco T, and Capel B (2009). Gonad morphogenesis in vertebrates: divergent means to a convergent end. Annu Rev Cell Dev Biol 25, 457–482. 10.1146/annurev.cellbio.042308.13350. [DOI] [PMC free article] [PubMed] [Google Scholar]
- 46.Yamamoto S, Bayat V, Bellen HJ, and Tan C (2013). Protein Phosphatase 1ß Limits Ring Canal Constriction during Drosophila Germline Cyst Formation. PLoS ONE 8, e70502. 10.1371/journal.pone.0070502. [DOI] [PMC free article] [PubMed] [Google Scholar]
- 47.Pepling ME, and Spradling AC (2001). Mouse Ovarian Germ Cell Cysts Undergo Programmed Breakdown to Form Primordial Follicles. Developmental Biology 234, 339–351. 10.1006/dbio.2001.0269. [DOI] [PubMed] [Google Scholar]
- 48.Soygur B, Jaszczak RG, Fries A, Nguyen DH, Malki S, Hu G, Demir N, Arora R, and Laird DJ (2021). Intercellular bridges coordinate the transition from pluripotency to meiosis in mouse fetal oocytes. Science Advances 7, eabc6747. 10.1126/sciadv.abc6747. [DOI] [PMC free article] [PubMed] [Google Scholar]
- 49.Lei L, and Spradling AC (2016). Mouse oocytes differentiate through organelle enrichment from sister cyst germ cells. Science 352, 95–99. 10.1126/science.aad2156. [DOI] [PMC free article] [PubMed] [Google Scholar]
- 50.Ueno H, Turnbull BB, and Weissman IL (2009). Two-step oligoclonal development of male germ cells. Proceedings of the National Academy of Sciences 106, 175–180. 10.1073/pnas.0810325105. [DOI] [PMC free article] [PubMed] [Google Scholar]
- 51.Nunley H, Shao B, Denberg D, Grover P, Singh J, Avdeeva M, Joyce B, Kim-Yip R, Kohrman A, Biswas A, et al. (2024). Nuclear instance segmentation and tracking for preimplantation mouse embryos. Preprint at bioRxiv, 10.1101/2023.03.14.532646. [DOI] [PMC free article] [PubMed] [Google Scholar]
- 52.Tunster SJ (2017). Genetic sex determination of mice by simplex PCR. Biol Sex Differ 8, 31. 10.1186/s13293-017-0154-6. [DOI] [PMC free article] [PubMed] [Google Scholar]
- 53.Gu B, Posfai E, and Rossant J (2018). Efficient generation of targeted large insertions by microinjection into two-cell-stage mouse embryos. Nat Biotechnol 36, 632–637. 10.1038/nbt.4166. [DOI] [PubMed] [Google Scholar]
- 54.Stringer C, Wang T, Michaelos M, and Pachitariu M (2021). Cellpose: a generalist algorithm for cellular segmentation. Nat Methods 18, 100–106. 10.1038/s41592-020-01018-x. [DOI] [PubMed] [Google Scholar]
Associated Data
This section collects any data citations, data availability statements, or supplementary materials included in this article.
Supplementary Materials
Video S1. Germline cyst cells are motile, driving fractures. Related to Figure 1.
A membraneGFP-labeled cyst in E12.5 ovary dividing from two to four cells, followed by an ICB fracture that gives rise to a three-cell and a one-cell cyst. H2B is shown in purple and labels nuclei.
Video S2. Germ cell protrusions in the gonad are randomly oriented. Related to Figure 2.
A membraneGFP-labeled E11.5 germ cell displays protrusions in seemingly random orientations, then divides.
Video S3. Inhibiting protrusions prevents fractures, while reducing ICBs increases them. Related to Figure 3. Movies of membraneGFP-labeled E12.5 female germline cysts in wildtype, CK-666 treated, TEX14 reduced + CK-666 treated, and TEX14 reduced ovaries.
Video S4. Protrusions decrease over developmental time in both sexes. Related to Figures 4 and 6. Movies of membraneGFP-labeled female (F) and male (M) germline cysts taken each day from E11.5-E14.5.
Data Availability Statement
The probabilistic fracture model code can be accessed at https://zenodo.org/records/11263587. All data reported in this paper will be shared by the lead contact upon request, and any additional information required to reanalyze the reported data in this paper is available from the lead contact upon request.