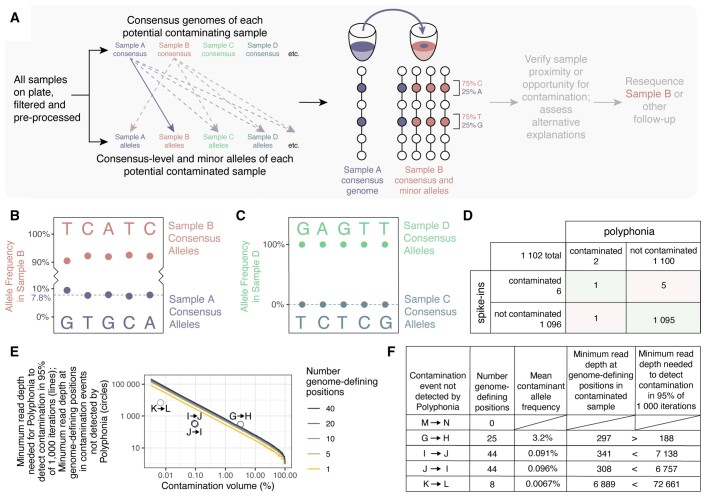
Figure 1.
Inter-sample contamination detection by Polyphonia. (A) All samples are compared pairwise to identify putative contaminating and contaminated samples. Sample A is flagged as contaminating Sample B if Sample A’s consensus alleles appear as minor alleles in Sample B at genome-defining positions where their consensus genomes differ. (B) Contamination by Sample A was detected in Sample B. Alleles and allele frequencies at genome-defining positions are shown. Sample B consensus-level alleles are indicated above; Sample A consensus-level alleles, identical to Sample B minor alleles, are indicated below. Median contaminating allele frequency is indicated by a dashed line. (C) No putative contamination by Sample C was detected in Sample D. Figure is as in B. (D) Results of validating Polyphonia against spike-ins in 1102 COVID-19 samples. (E) Minimum read depth required to detect contamination at all genome-defining positions, thereby enabling detection by Polyphonia with default parameters, in 95% of 1000 iterations. The four instances of contamination not detected by Polyphonia with ≥1 genome-defining positions are shown by circles. (F) Minimum read depths needed to detect contamination and observed minimum read depths at genome-defining positions in the five instances of contamination not detected by Polyphonia.

