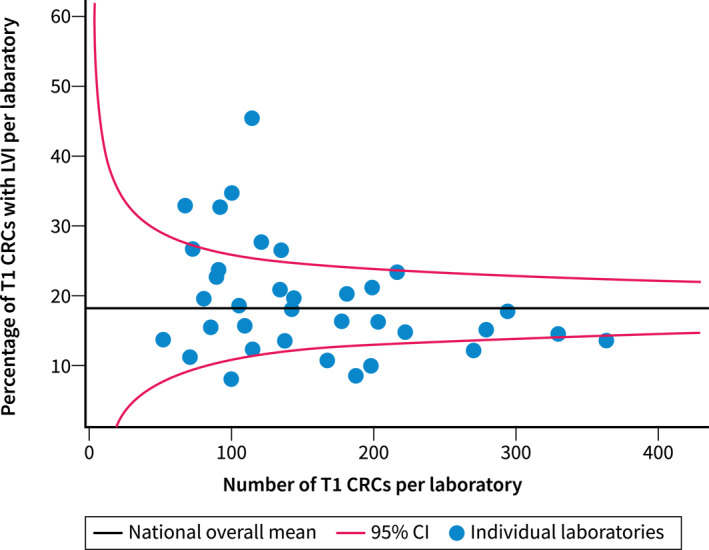
FIGURE 2.

Funnel plot showing the percentage of T1 CRCs with positive LVI per laboratory from the Palga cohort adjusted for case‐mix factors, plotted against the total number of T1 CRCs from the corresponding laboratory. CI, confidence interval; CRC, colorectal cancer; LVI, lymphovascular invasion.
